

Stay Up to Date on the East Bay Market
Over and Above the Asking Price
34% of SF houses and 18% of condos sold in April sold for 20% or more above asking.
Staggering percentages, especially considering San Francisco’s extremely high home prices.


Buyer Seller Dynamics

April 2014 Buyer-Seller Dynamics in San Francisco
This April 2014 analysis was based upon a survey of Paragon Real Estate Group agents regarding their past 12 months of activity: Paragon agents close over 1000 San Francisco home transactions per year; Paragon’s Van Ness office represents more buyers in successful city home purchases than any other brokerage office.
All percentages are approximate: This was not a rigorously controlled survey and analysis, but more an informal poll; still we believe the data below does generally reflect market dynamics in San Francisco.
San Francisco Home Sellers
60% are selling to relocate outside of San Francisco: The main reasons, in order of prevalence, are schools (and other family-raising reasons) -- which ties in with the fact that SF has the lowest percentage of children of any major city in the country -- affordability (the ability to buy more home for the money elsewhere), job-related reasons (relocation, commute) and retirement.
15% involve trust, probate or investor sales, or people moving into rentals or retirement homes, and no new home purchase is involved.
25% are selling in order to buy another property within the city, typically either upgrading to a more expensive home or downsizing to a smaller home, or a divorce is involved.
San Francisco Home Buyers

50% are first-time buyers. This is a very high percentage: In the U.S. the percentage is about 30% (and, of course, the U.S. median price is under $200k, while the SF median is over $950,000).
Average age of SF home buyers is generally getting younger and is currently in the mid-thirties.
47% of SF home buyers are employed in high tech. This is a distinctly San Francisco phenomenon related to the first 2 points above: An influx of relatively young, often newly affluent, high-tech employed, often first-time buyers – who can afford SF home prices – is playing a decisive role in the market.
20% of prospective SF home buyers have become discouraged and given up on buying in the city, due to the competitive environment and rapidly appreciating prices. They’ve either given up for the time being or shifted their home searches elsewhere.
Less than 3% of SF home buyers are foreign – exposes the myth of foreign money playing a significant role in the SF market. What purchases/investments they are making seem to be mostly in new or newer, high-rise condo developments. (There are cities in the U.S. in which large numbers of foreign buyers are having a significant impact on the market - Miami may be the most dramatic example - but SF is not one of them at this time.)
26% of homes are being purchased via “all cash” offers, though many of these offers are structured this way solely for strategic reasons to get their offers accepted in an exceedingly competitive environment. That is, many of these buyers end up getting loans either before or immediately after close of escrow. (This is a different phenomenon than investors paying all cash for distressed homes in other parts of the country – San Francisco has had very few of these sales in the past 2 years.)
Approximately 10% of home sales occur outside of the multiple listing service, i.e. as so-called off-market/ off-MLS/ pocket listings. This agrees with other analyses Paragon and others have performed.
Conclusions: To a greater extent than is probably normal, there is an exchange process occurring in San Francisco, with existing residents moving out and new residents moving in. One of the biggest reasons for selling is to relocate for better public schools outside SF or to save money by enrolling children in suburban public instead of city private schools; high prices are motivating some city homeowners to cash out to buy bigger/better homes elsewhere; frenzied market conditions are discouraging homeowners who might otherwise sell to buy other (larger, better) homes within the city – many of these homeowners are staying put out of trepidation. This last situation is affecting/lowering the supply of homes for sale.
Population/ Employment Growth and Housing
According to the latest U.S. census data, the estimated increase in the city’s population since 2010 is 32,000; over the same period, the number of employed residents has jumped by over 55,000. Per the Planning Department, the approximate number of new housing units added since 2010 is 4200. With 38% of SF’s households consisting of 1 person, and an average household size of 2.3 persons, we’re looking at over 22,000 new residents who have been looking for homes that don’t exist. This is one of the biggest factors behind the huge upward pressure on rents and home prices.
With the market recovery that began in 2012, another 6000 housing units are currently under construction and most should be ready sometime in the next 2 years. Housing units include condos (sales), apartments (rentals), houses (a very few) and community housing projects.
White Hot Spring Market

White Hot Spring Market

The hotter the competition between buyers, the higher home prices are bid up. The great majority of SF home listings are selling quickly and for over - sometimes far over - asking price.

This chart tracks the trend over the past 2+ years
Of Real Estate, Gold and Apple Stock

Of Real Estate, Gold & Apple Stock
May 2014 Report
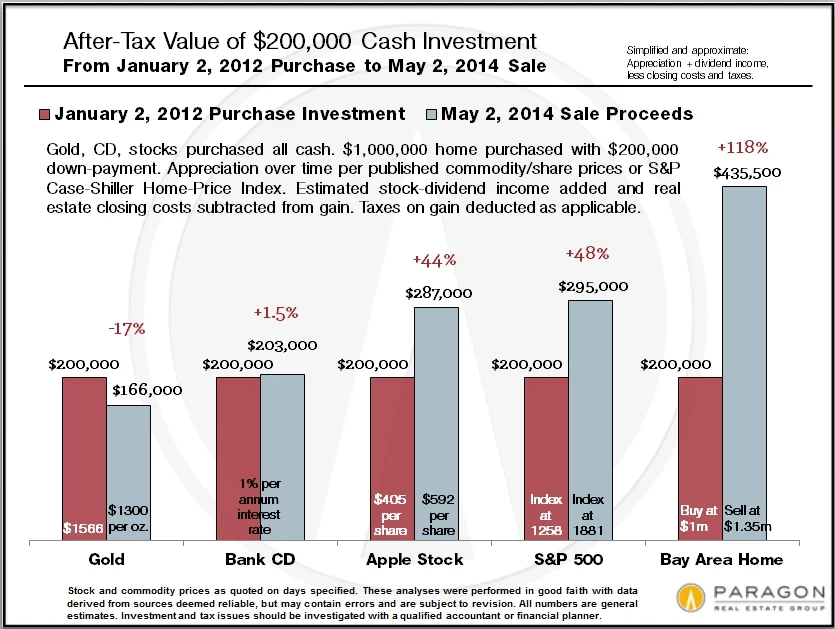
On January 1, 2012, you woke up to find $200,000 on your bedside table, which you decided to invest. Then, on May 2, 2014, you sold your investment. Below are your approximate returns depending on where you placed your cash.

Assumptions:
Gold: you bought at $1566 per ounce and sold at $1300 per ounce: Bad timing.
Certificate of Deposit: 1% annual interest rate; interest taxed as ordinary income: It seemed like the safe thing to do in an uncertain world.
Stock purchases: Apple stock jumped 46% and the S&P 500 50%; plus an estimated dividend yield of 5%; profit taxed as long-term capital gains. (No transaction costs included in calculation.)
Home purchase: $200,000 down-payment on $1 million home; 35% home-price appreciation per Case-Shiller; 2% closing costs on purchase and 7% on sale deducted from gain. No capital gains tax due to the $250,000/$500,000 exclusion for sale of primary residence. The estimated $28,000 reduction in loan principal was not included in gain, as it pertains to monthly home payments made after initial investment.
It is assumed that the net monthly home cost - principal, interest, property taxes and insurance, after tax deductions and reduction in loan principal - at an estimated $3250/month, was comparable to cost of renting. This has generally been true in San Francisco due to high rents and low interest rates.
There are 3 big reasons why real estate dramatically outperformed the stock market, though both markets boomed: 1) leverage - 35% home-price appreciation equals 175% appreciation of your 20% cash down-payment (before closing costs); 2) big tax deductions subsidize home ownership costs, and 3) the capital gains exclusion on the sale of a primary residence.
Important: Timing is everything in investing. In this analysis, the chosen buy date was January 2, 2012 when the financial and housing markets were poised for big rebounds. Picking a different purchase date, such as January 2, 2008, would completely alter the results. *

Paragon Ranks #3 Nation Wide

Paragon Featured in New Ranking Report
The new RealTrends 500 report ranking the sales statistics of the 500 largest residential brokerages in the country for 2013 sales was just published. After 10 years in business, Paragon came in #3 in average sales per agent and #4 in average sales price in the national ranking.

Prices Jumping Across SF

Prices Jumping - Yet Again - Across San Francisco
April 2014 Real Estate Market Report
The San Francisco real estate market grew increasingly frenzied as the first quarter of 2014 progressed, leading to another surge in home prices in virtually every neighborhood in the city. The high-demand/ extremely-low-inventory/ competitive-bidding situation is similar to what occurred first in spring 2012 and then, to an even higher degree, in spring 2013. After the market seemed to stabilize in the second half of last year, we didn't expect to see it turn this fierce in early 2014, but right now it appears to be every bit as ferocious as last spring's.
Of major metro areas, the new Gallup-Healthways survey ranked SF-Oakland second in the nation (behind San Jose-Santa Clara) on their index for "well-being." Though already the second most densely populated city in the country (after NYC), San Francisco simply has many more people wanting to live here than there are homes available to rent or buy.

This chart below breaks down, by neighborhood, the average sales price to list price percentage for the 90% of homes selling without price reductions. Of the areas assessed, Bernal Heights came out on top with sales prices averaging an incredible 21% over list prices over the past 2 months.

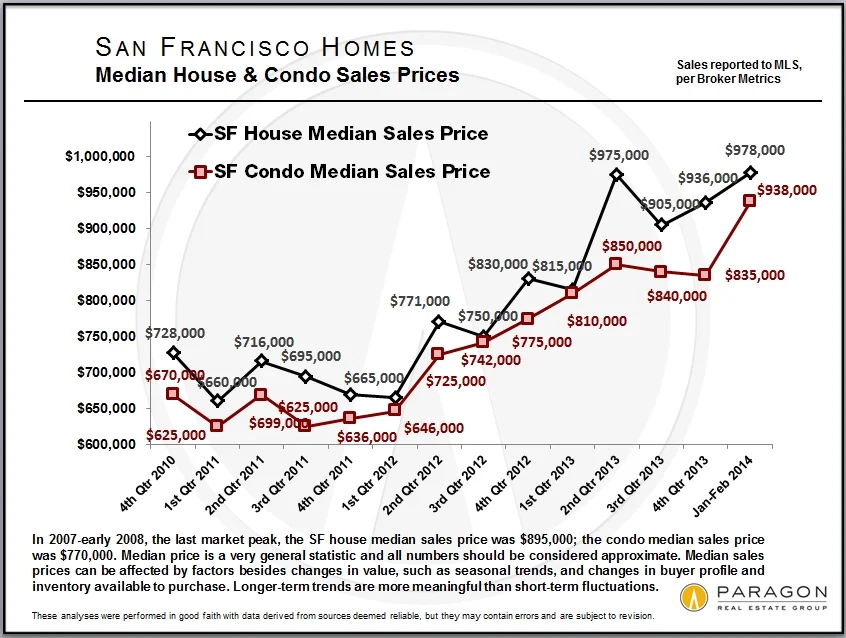
Typically, the first quarter of the year does not show a dramatic increase in median sales prices over the previous quarter - in fact, a decline in not unusual due to holiday market dynamics. But the first quarter of 2014 saw large spikes in median prices for houses and, especially, condos in San Francisco.
This next chart is a look at quarterly median price appreciation over the past 3 years. The beginning of the market turnaround can be clearly discerned in early 2012. Note that quarterly fluctuations are not uncommon and can be caused by a number of factors besides changes in values.

While virtually the whole country has been experiencing a big market rebound, San Francisco, because of our particular economic circumstances, is outperforming almost every other market area. The big exception is Silicon Valley, whose high home appreciation rate is being driven by many of the same employment and demographic causes as here in the city.

When the market recovery began in earnest in early 2012, there were complaints of a shortage in inventory. In 2013, the market grew even more heated and supply declined further to what felt like desperately low levels. Now in 2014, amid no lessening of demand that we perceive, the supply of SF homes available to purchase has dropped again.
There are increasing numbers of new-construction housing units coming on market - and many more being planned and built - but so far they're being snapped up, at very high prices, without noticeably altering the supply and demand dynamic.


San Francisco Neighborhood Snapshots
We updated analyses for a number of city neighborhoods with enough sales for quarterly data to be meaningful. In every district we looked at, there were significant spikes in median sales prices and/or average dollar per square foot values in the quarter just ended.
Below are 3 samples, but our full collection of long-term neighborhood analyses can be found here (some updated through the first quarter, others through the end of 2013): San Francisco Neighborhood Values


© 2014 Paragon Real Estate Group
Are You Ready to Buy a Home?

Thinking of Buying Your First Home?
These questions will help you gauge your readiness to start the process. If you are ready, let's get together for a one on one consultation to explore your options for home ownership.
 So are you ready? Let's get started!
Where You Can Buy For the Money You Want to Spend

Where You Can Buy for the Money You Want to Spend
San Francisco Home Sales by Neighborhood
You want to buy a house in San Francisco for under a million dollars, or for over $2 million, or you have $1,800,000 to spend on a luxury condo with a spectacular view. If you're buying a house in San Francisco, your price range effectively determines the possible neighborhoods to consider. That does not apply quite as much to condos and TICs, except for sales in the luxury segment: generally speaking, in neighborhoods with high numbers of condo and TIC sales, there are buying options at a wide range of price points, though, obviously, size and quality will vary. Also, all the new condo projects being built in many different areas of the city is changing the neighborhood pricing dynamic for condos.
For your convenience, a neighborhood map can be found at the bottom of this report.
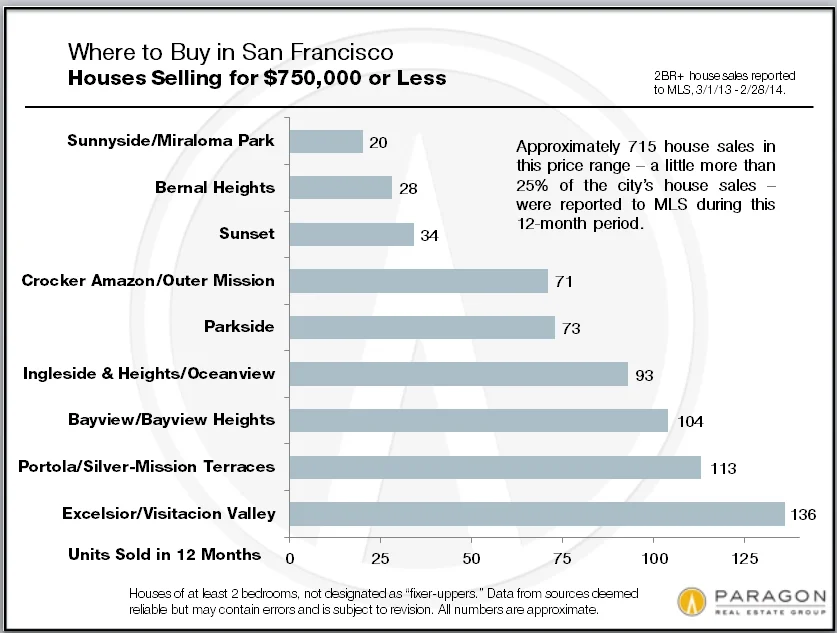
The charts below are based upon sales reported to MLS in the 12 months between March 1, 2013 and February 28, 2014. We've broken out the neighborhoods with the most sales within given price points. There are exceptions to neighborhood norms scattered throughout the city and in an appreciating market these price ranges having been moving upward.
Houses in these neighborhoods began their recovery from the market downturn a step or two behind more expensive areas in San Francisco, but now the markets here are red hot and very competitive, and home prices are under very strong upward pressure.


In this price point, one moves into a big circle of neighborhoods in the middle of the city plus the Richmond District in the northwest. Within this circle, one will typically get significantly more house for one's money in the Sunset, Central and Outer Richmond, Miraloma Park or Bernal Heights than in Glen Park or Potrero Hill, or especially, Noe or Eureka Valley.

As the price range goes up, the number of sales begin to narrow. The neighborhoods in this house price range are similar to the previous range, but sales predominate in central Realtor District 5, which comprises the greater Noe- Eureka-Cole Valleys area. District 5 has been a white hot market for the last two years and competition for homes here is ferocious.

Rather arbitrarily, houses selling for $2 million and above, and condos, co-ops and TICs selling for $1.5 million and above are designated as luxury home sales in San Francisco: these homes now make up about 14% of total home sales (up from about 10-11% a few years ago). Once again, what you get in different neighborhoods for $2 million can vary widely - a large, immaculate house in one place, a fixer-upper in another.
Luxury home sales in San Francisco are dominated by the swath of established, prestige northern neighborhoods running from Sea Cliff through Pacific Heights and Russian Hill to Telegraph Hill, by the greater Noe-Eureka-Cole Valleys district, and, to a lesser extent, the smaller neighborhoods around St. Francis Wood. For luxury condos, the greater South Beach-Yerba Buena-Mission Bay area has a large and growing presence as big, expensive condo projects have sprouted there over the past 15 years.
In the general category of condo, co-op and TIC sales in San Francisco, condos make up almost 90% of sales, TICs almost 10% and stock co-ops 1 to 2%. TICs typically sell at a significant discount to similar condos, but there are a number of factors that affect the exact price differential.
Of the approximately 3300 condo, co-op and TIC sales in the past year, about 64% sold for under $1,000,000. These sales take place in virtually every area of the city that features these property types, but a studio unit in Nob Hill will cost the same as a 1 or 2 bedroom unit in Downtown. Some areas with large volumes of sales, such as South Beach/South of Market or Pacific Heights/Marina, offer units for sale at virtually every price point. In such districts, what will vary will be the prestige and amenities of the building, the size and graciousness of the unit, the floor the unit is located on, and the existence of views and deeded outside space (decks, patios, or, less often, yards).


In this price point for houses, one moves into the big circle of neighborhoods in the middle of the city plus the Richmond District in the northwest. Within this collection of neighborhoods, one will typically get significantly more house for one’s money in the Sunset, Central or Outer Richmond, Miraloma Park or Bernal Heights than in Glen Park or Potrero Hill, or especially, Noe or Eureka Valley.
Condo, co-op and TIC sales in this price range are mostly concentrated in the more affluent districts.

With the construction of new high-end, high-tech-amenity condo projects on Market Street and Van Ness, and in neighborhoods like the Inner Mission, Hayes Valley and Inner Richmond -- often selling for more than $1000 per square foot -- luxury condos are now spreading into new areas of the city.

It wasn't so long ago that houses selling in Realtor District 5, the greater Noe/Eureka/Cole Valleys area (which includes Clarendon, Corona and Ashbury Heights), for over $2 million were an exception. But that is certainly not the case any longer. If we looked closer at the sales in the $2 million to $5 million, we'd find the higher end of the range dominated by Realtor District 7, the Pacific Heights-Marina area, the most expensive house market in the city. Though District 5 does see sales in the $3.5 to $5+ million range, most of its luxury houses sell between $2 million and $3.5 million. There are several other significant areas for these high-end houses, such as Lake Street/Sea Cliff, St. Francis Wood/Forest Hill and Lower Pacific Heights.
Most luxury houses in the city were built in the period between 1905 and 1950, reflecting the era of construction dominating these neighborhoods of San Francisco -- and a gracious, elegant era it was. However, there are a small number of big, new houses built each year, as well as some beautiful fifties houses scattered here and there, and, of course, many of the older houses have been extensively renovated over the years.


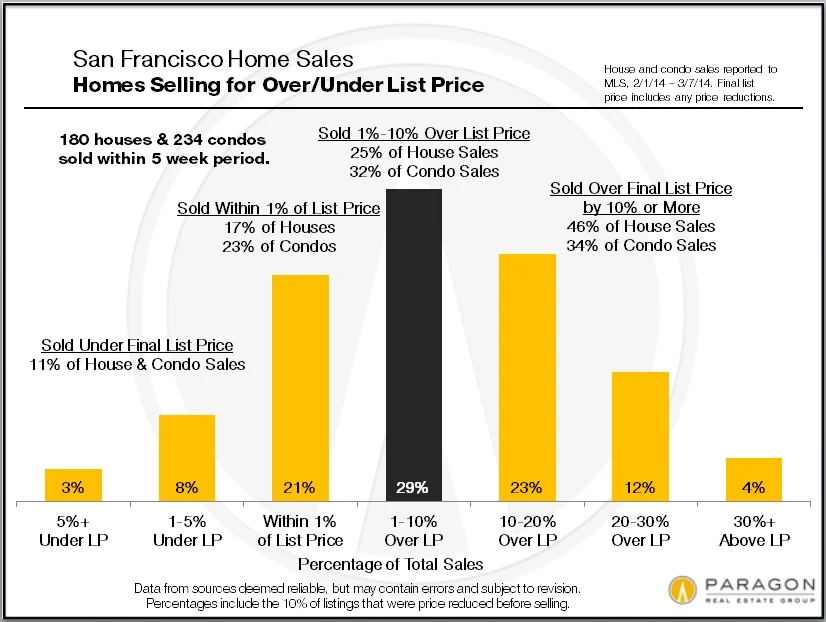
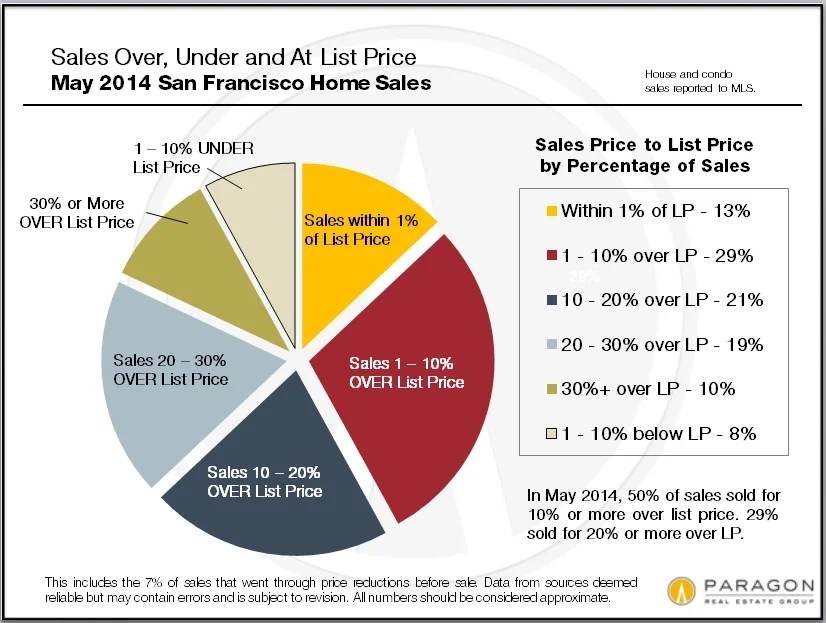
Homes Selling for Over/Under List Price

Looking back at the last 5 weeks of house and condo sales: 2 in every 5 sales sold for 10% or more over list price; 1 in every 6 sold for 20% or more over list price; the largest group of sales—almost 1 in 3 – closed between 1% to 10% above asking; 1 in 5 sold at asking or within 1% of list price; and about 1 in 9 sold below asking price by at least 1%.
Pressure Builds in the SF Market

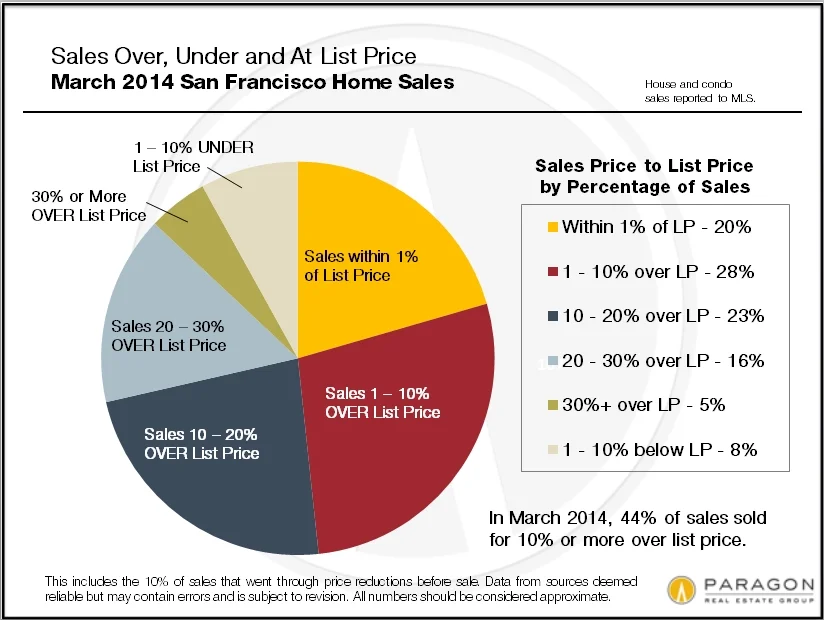
Price Pressure Builds Again in San Francisco Homes Market
March 2014 ReportUpward pressure on home prices is based on one basic dynamic: more demand than there is supply to satisfy it. Various factors can supercharge demand, such as extremely high rents and low interest rates, which make homeownership more attractive, as well as a sudden, large influx of new, affluent buyers (our high-tech boom) piling into what is basically a relatively small, inventory-constrained market. When there are 5, 10 or sometimes 20 qualified buyers chasing after every attractive, reasonably priced, new listing, prices typically go up, sometimes quite quickly. Last year, after the spring feeding frenzy, the market generally stabilized through the end of the year: It continued to be a strong market by any measure, but prices mostly plateaued, albeit often at new peak levels. We recently speculated on tentative signs that suggested a further market normalization, but now the indicators are pointing in a different direction. The inventory of homes available to purchase on any given day is even lower than before last year's furious market; buyer demand has emerged from its midwinter hibernation like a hungry bear; and prices are under increasing pressure once again. The spring selling seasons of 2012 and 2013 saw huge spikes in home price appreciation. Now we enter the third spring since our market recovery began in earnest, and the desire to live in our small, beautiful, expensive city continues unabated. We shall see how it plays out in the coming months. |
||||||||||||||||||||||||||||
|
||||||||||||||||||||||||||||


2 bedroom Condo Price Appreciation
2 Bedroom Condo Price Appreciation
Let's take a moment to look at how 2 bedroom condos have been fairing in the overall market.

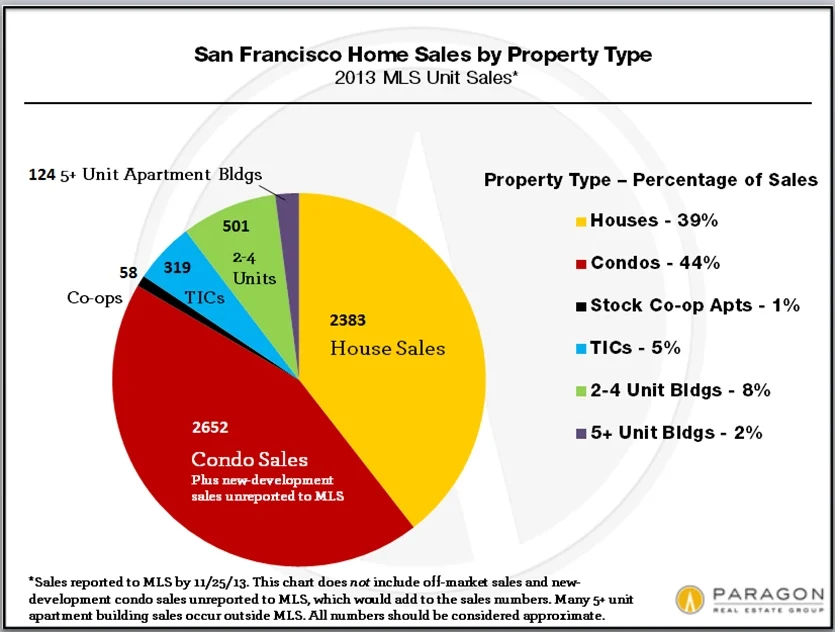
If new-development condos were included, condo sales probably started outnumbering SFD sales about 9 or 10 years ago. Looking just at sales reported to MLS, that switch occurred in 2012 (the majority of new condo sales do not get reported to the MLS). This trend will only continue to accelerate with all the new condo construction occurring in the city. There are few counties in the country where condo sales outnumber house sales.

- Condo Unit Sales by Year

TIC and 2-4 unit building unit sales have fallen dramatically since their peaks. As time goes on, there are simply fewer and fewer 2-4 unit buildings existing in the city that haven’t been turned into condos and TICs. TICs have been affected by a number of issues: conversions into condos, new restrictions and costs on tenant evictions, changes in lending terms, and so on. The general decline of 2-4 unit buildings is irreversible since hardly anyone is building more of them. The inventory and sales volume of TICs may change.
Tentative Signs of a Shifting Market

Tentative Signs of a Shifting Real Estate Market
February 2014 San Francisco Market ReportIt is far too early in the year to reach definitive conclusions regarding substantive changes in the market, but there are indications of a number of shifts. From the hurly burly on the street, the word is that the quantity of offers coming in on new listings is declining. Where a new listing might have attracted 10 or 12 offers last spring, 3 or 4 are coming in now; where 3 or 4 offers would have arrived, the seller is getting 1. And, according to Broker Metrics, for every 2 listings that accepted offers in December and January, another listing expired or was withdrawn without selling. The amount of competition deeply affects home price increases. There are still a very large number of buyers looking at listings online and at open houses. But more of them appear to be first-time buyers and they are proceeding more cautiously. Some buyers are burned out on the multiple-offer bidding frenzies of last year and are reluctant to participate in them. Though the market remains hot by any reasonable standard, by some statistical measures it is cooling. This may reflect a transition or only a lull before the spring sales season begins. Recently, the investment-property analysis firm Reis speculated that SF apartment-rent growth -- which has been extraordinary by any measure, especially in a period of low inflation -- will slow despite intense demand and very low vacancy rates, simply because people can't pay any more. It's an idea which may or may not be correct or apply to other types of housing costs. Rent rates do play a role in purchase prices as buyers often compare the net housing costs of the two options. 
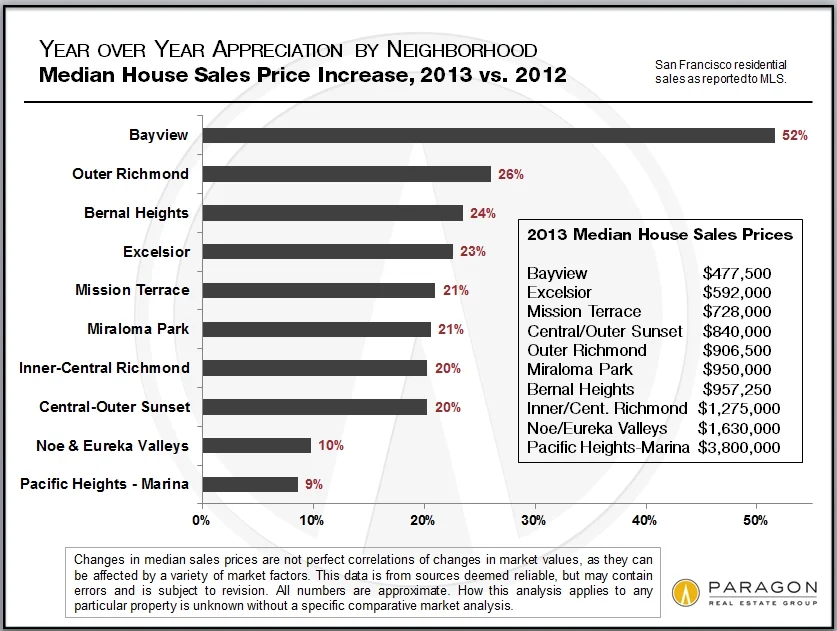
Median Sales Price Appreciation by Neighborhood In San Francisco, some of the most affluent neighborhoods -- such as the Pacific Heights-Marina district and the Noe, Eureka and Cole Valleys district -- started their recoveries in the second half of 2011, well before virtually every place else in the city or country. When 2012 began, prices in these districts soared, while other areas played catch up. In 2013, that dynamic flipped: Appreciation rates in comparatively less expensive neighborhoods surged, while slowing in the most affluent areas. A big part of this is simple affordability: Priced out in one neighborhood (or city), buyers focused on others, similar in ambiance but less costly. Home prices there looked so good in comparison that buyers were willing to bid them up. The huge decline of distressed sales in areas severely affected, such as in Bayview, has had an outsized effect on median sales prices there. Continuing gentrification, as in the Mission, and increasing "luxury" condo construction in less affluent areas have also played parts in this trend. It's not as if demand plunged in the Pacific Heights-Marina district (or Noe Valley, for that matter). Quite the contrary: its 9% appreciation rate in 2013 translated into the city's largest median price increase in dollar terms ($300,000). However, in the previous year, this district saw year over year median price appreciation of 25%. Note that median price appreciation does not perfectly correlate to changes in home values, as it can be affected by a variety of market factors. It does give an approximate sense of market trends. |
||||||||||||||||||||
|
||||||||||||||||||||
|
January is not a high-sales quantity month as its sales mostly reflect accepted-offer activity in December, the slowest month of the year, and monthly median price data is not that reliable as it can fluctuate without great meaningfulness. However, an odd data point came up for median sales prices in January: The median price for SF houses dropped an insignificant amount, from $938,000 in the 4th quarter of 2013 to $928,000 in January (down from a brief spike to $976,000 in the 2nd quarter). However, the median sales price for SF condos made a very big leap from $835,000 in the 4th quarter to $927,500 in January, the highest monthly condo median price ever. Of the 144 January condo sales reported to MLS as of 2/8/14, 45 sold for $1,200,000 or more. This is an unusually high percentage of high-end condo sales, especially for a January -- January 2013 had 19 such transactions -- and is probably just one of the anomalies we sometimes see in monthly sales data. (We much prefer longer-term data.) We'll have to watch what happens in future months. One can never take for granted exactly what is going to happen next in the San Francisco real estate market. Please call or email if you have any questions or comments regarding these analyses.
Statistics are generalities that sometimes fluctuate without great meaningfulness and may be affected by a variety of seasonal, inventory and economic factors. How they apply to any particular property is unknown without a specific comparative market analysis. All data from sources deemed reliable, but may contain errors and is subject to revision. © 2014 Paragon Real Estate Group |
||||||||||||||||||||


California Median Home Prices by County
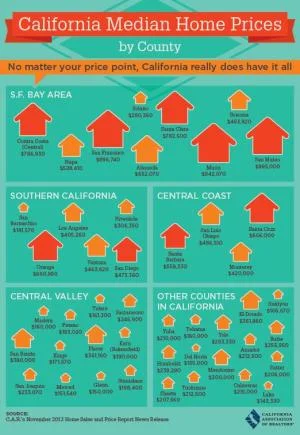
California Median Home Prices
 Marin County may be in the lead but San Francisco is a very close second.

San Francisco Fairs, Festivals and Events 2014

It’s hard to believe it’s already 2014! There’s such an abundance of events throughout the year in our amazing city, where does one begin? Well, we have something to help get you started. So before you book up your weekends, check out our handy event calendar to give you some inspiration. (CLICK ON THE IMAGE TO EXPAND).


Looking Back, Looking Ahead
San Francisco Real Estate: Looking Back, Looking Ahead
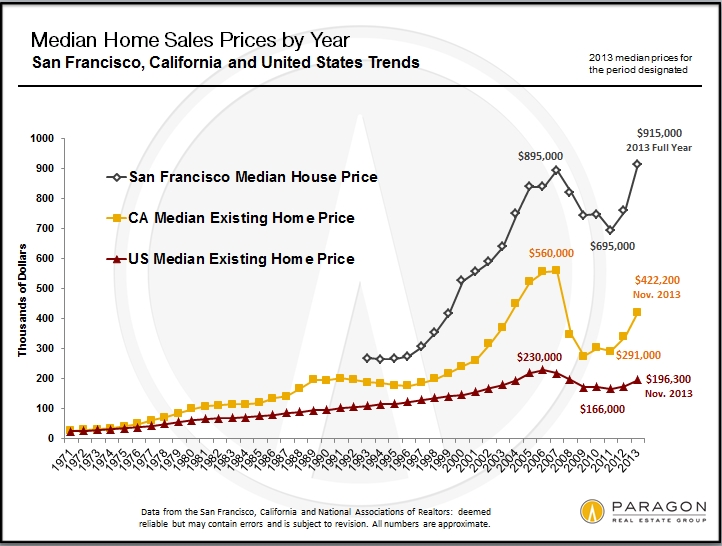
January 2014 Market ReportThe real estate market recovery started in earnest in 2012 and then went white hot in spring 2013, which resulted in a huge jump in home prices. In the last six months of the year, the market calmed somewhat and prices generally stabilized, but buyer demand remained very strong by historical standards. Economic conditions have continued to improve, household net worth has increased dramatically with rising stock and housing markets, rents remain very high, new construction is soaring and interest rates, after jumping in 2013, are still relatively low. Though it is impossible to predict the future, these factors typically form the foundation of a healthy, active housing market. In the next few weeks, new listings will start coming on market in quantity, buyers will get back in home-search mode and the market will begin to wake up after the holiday hibernation. Then we'll start to get an inkling of what the new year has in store. If you missed our survey of what San Francisco homebuyers bought in 2013, you can find it here: 2013 Market Survey. It was reported on by SFGate, KGO Radio and other major media. |
||||||||||||||||||||||||
|
||||||||||||||||||||||||
|
Please call or email if you have any questions or comments regarding these analyses.
All data from sources deemed reliable, but may contain errors and is subject to revision. Statistics are generalities and how they apply to any particular property is unknown without a specific comparative market analysis. All numbers should be considered approximate. © 2014 Paragon Real Estate Group |
||||||||||||||||||||||||


What Buyers Purchased in 2013

Penthouses, Mansions, Short Sales & Fixer-Uppers
What Did San Francisco Homebuyers Buy in 2013?
Views, prices, architecture, neighborhoods, property types and sizes, parking, probate sales and appreciation rates: We data-mined all of San Francisco's 2013 sales reported to MLS through the end of November and charted the results below.


New Construction Updates for San Francsico

There are a number of new developments in San Francisco that are being planned, in progress, and selling out as we speak. Here’s a selection of projects around the city to give you an idea of recent changes, ones that are currently happening, and ones that are just around the corner.
 Status: In planning, approved, about to break ground, breaking ground.
 Status: Under Construction, almost complete, pre-sales.
 Status: Selling, almost sold-out, sold-out.
[pageview url="https://mapsengine.google.com/map/embed?mid=zWKG5aJTk8go.kOm8sOD6nH1o" title="New Construction Update"]
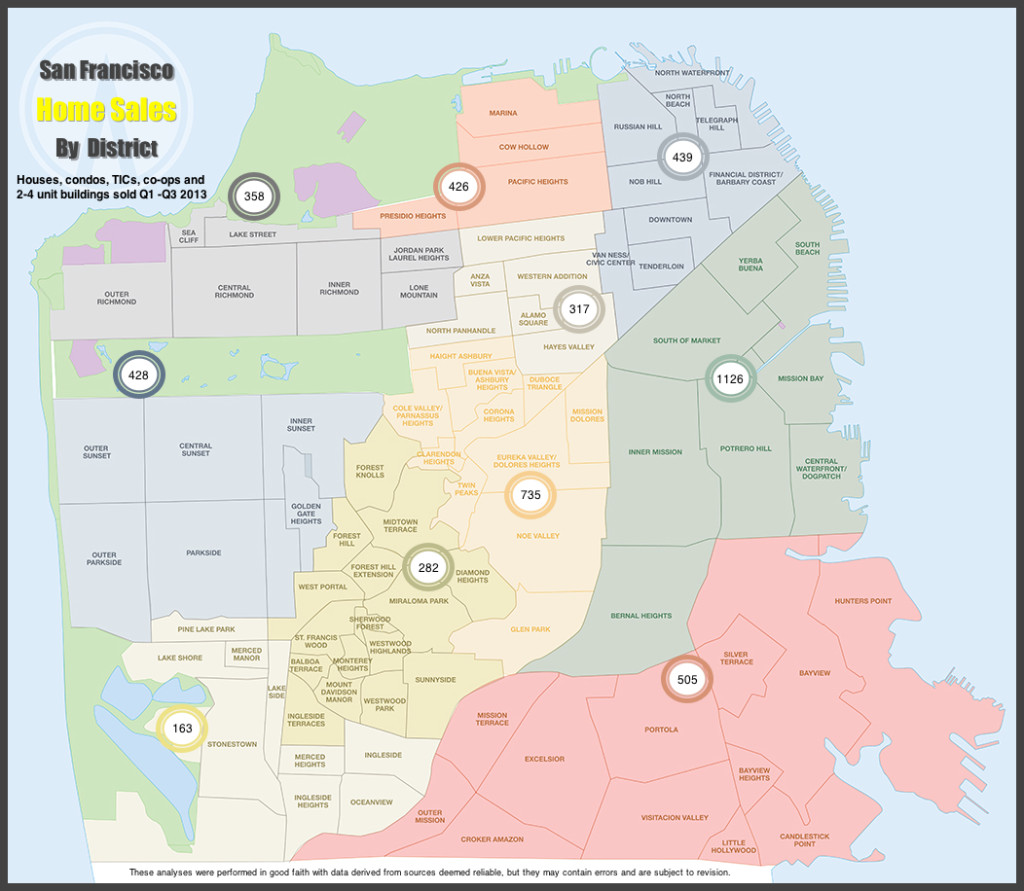
SF Home Sales by District
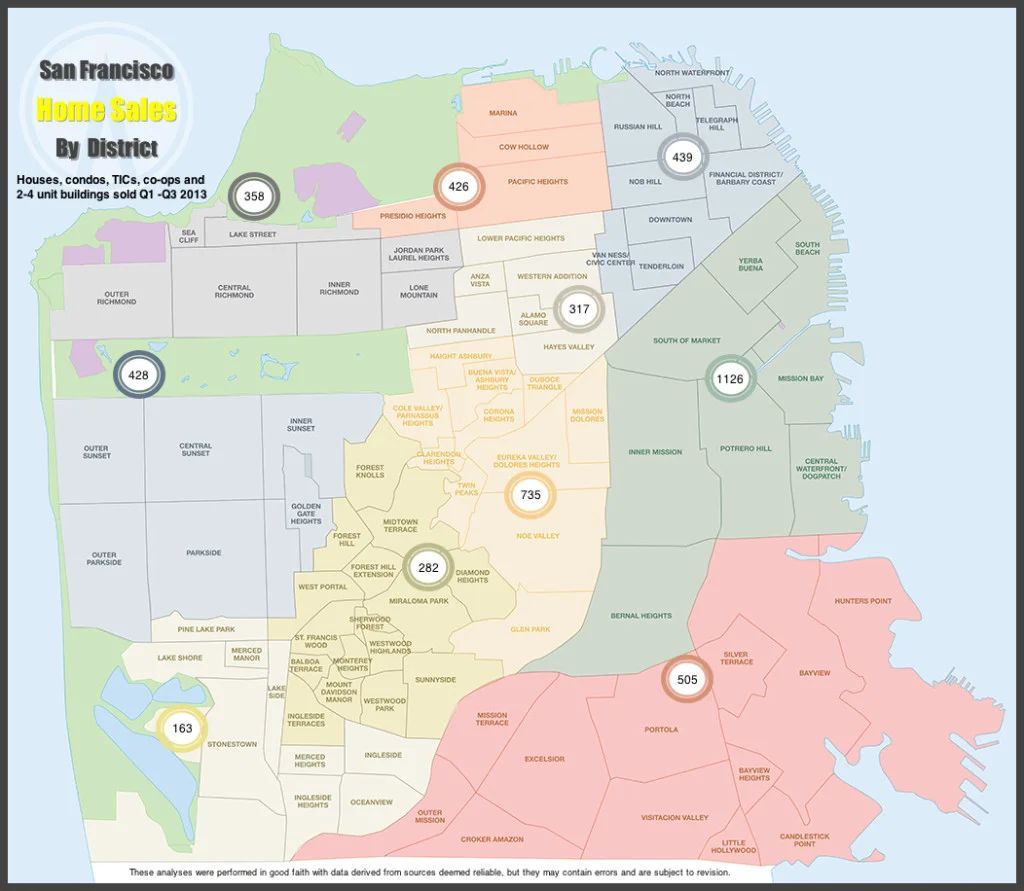
San Francisco Home Sales by District
There’s been a lot said about San Francisco’s hugely active real estate market this year, and which part of the city is feeling it the most. These numbers, broken down by sales per district, should do a decent enough job of speaking for themselves, and offer a pretty good snapshot of what this year’s activity has been like as far as total sales.

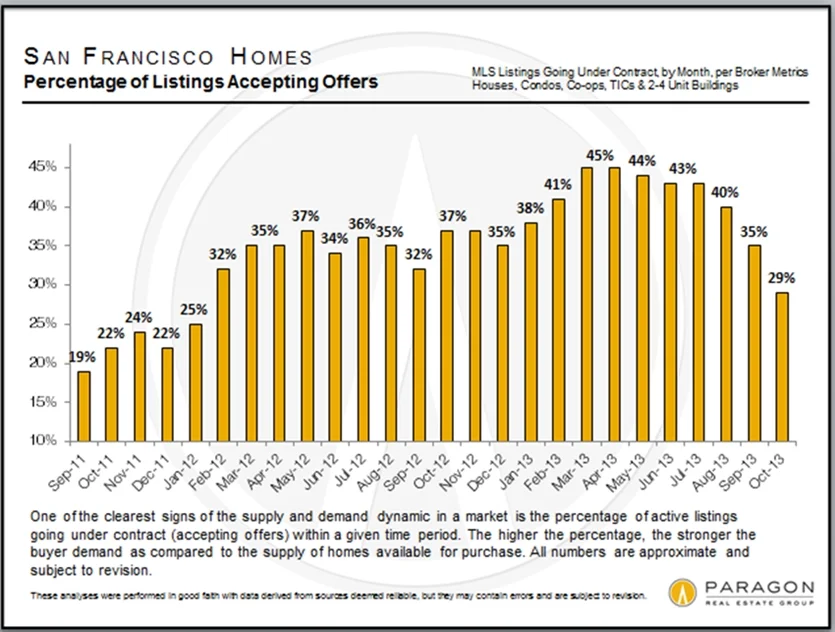
Mixed Signals from October Market

Mixed Signals from October MarketGovernment Shutdown & Default Fears Affect SF Homes MarketParagon Real Estate Report, November 2013The number of home listings accepting offers was way down in October (when it usually goes up); months-supply-of-inventory was significantly up (when it usually goes down in October); average days on market were still very low; median sales price was generally stable: The San Francisco real estate market is currently delivering a wide variety of signals, some of them undoubtedly influenced by the U.S. government shutdown fiasco, which dominated the first 3 weeks of last month. |
||||||||||||||||||||||||
|
||||||||||||||||||||||||


