

Stay Up to Date on the East Bay Market

Home Values in the San Francisco Bay Area

Home Values around the San Francisco Bay AreaA map of median house sales prices by city and town for 3rd quarter 2013 sales reported to MLS. In the map above, "k" signifies thousands of dollars and "m" millions of dollars. In one or two instances where the number of sales was insufficient for meaningful statistics, the median sales price is for the 2nd and 3rd quarters combined. Maps that break down median sales prices and average dollar per square foot values for houses and condos in the different San Francisco neighborhoods can be found here: All data from sources deemed reliable, but may contain errors and is subject to revision. Statistics are generalities and how they apply to any particular property is unknown without a specific comparative market analysis. All numbers should be considered approximate.© 2013 Paragon Real Estate Group
|
3rd Quarter Home Sales
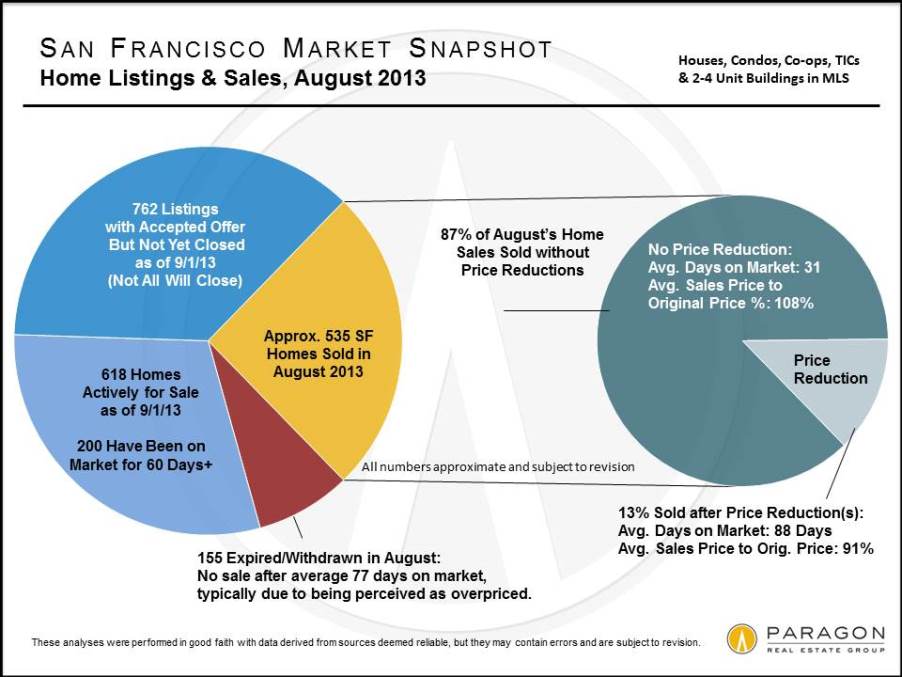
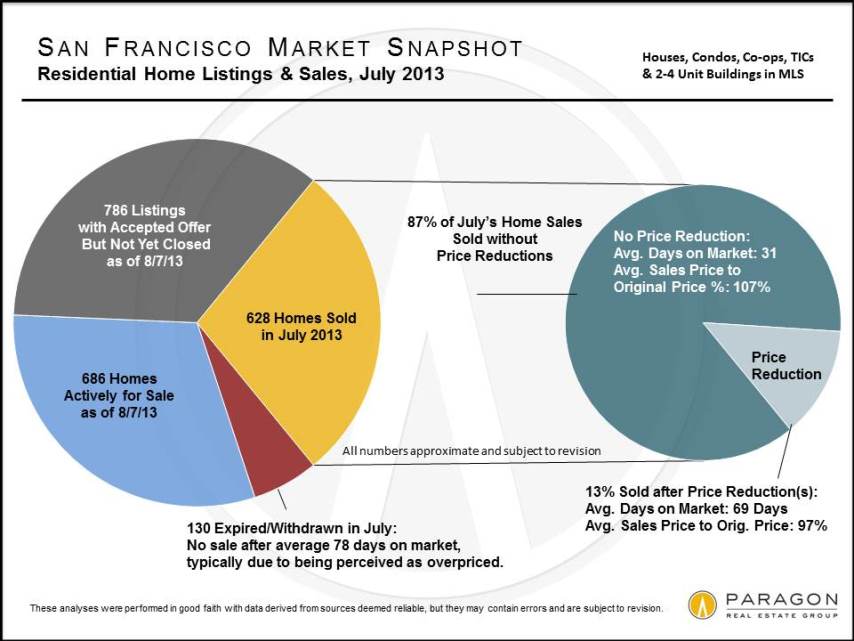
3rd Quarter Home Sales Snapshot
These statistics for the third quarter indicate a market that is still extraordinarily strong by any historical measure: 87% of home sales sold quickly without price reductions, at an average of almost 8% over asking price. It did cool down somewhat from our insanely frenzied spring season, but part of that is explained by the typical summer slowdown dynamic. How the market performs in the next two months will tell us a lot about whether the market is settling down, transitioning to a new phase or continuing to race along in high gear.


Click to Expand
San Francisco Median Home Sales Prices It’s not unusual for median prices to fall in the first and third quarters (affected by winter and summer holidays) and rise in the second and fourth quarters (prime spring and autumn selling seasons). This is what happened in this past third quarter and it typically has more to do with seasonal factors than changes in market values. One has to look at the longer term trend, not monthly or quarterly fluctuations, to determine what’s really happening in the market. For the last 6 quarters, the overall trend in home prices has been upward. For median price by district, visit our interactive map.

Click to Expand
Inventory of Homes for Sale The inventory of active homes for sale gives an idea of the choices a homebuyer has on any given day. September did see a spike in the number of new listings, but it wasn’t anywhere as big as we had hoped for.

Click to Expand
Months Supply of Inventory (MSI) MSI did climb in September due to the increase in the number of new listings — which is typical for September. Usually, MSI drops again in October as buyers snap up those new listings. Even with the increase, the reading signifies a strong “sellers’ market.”
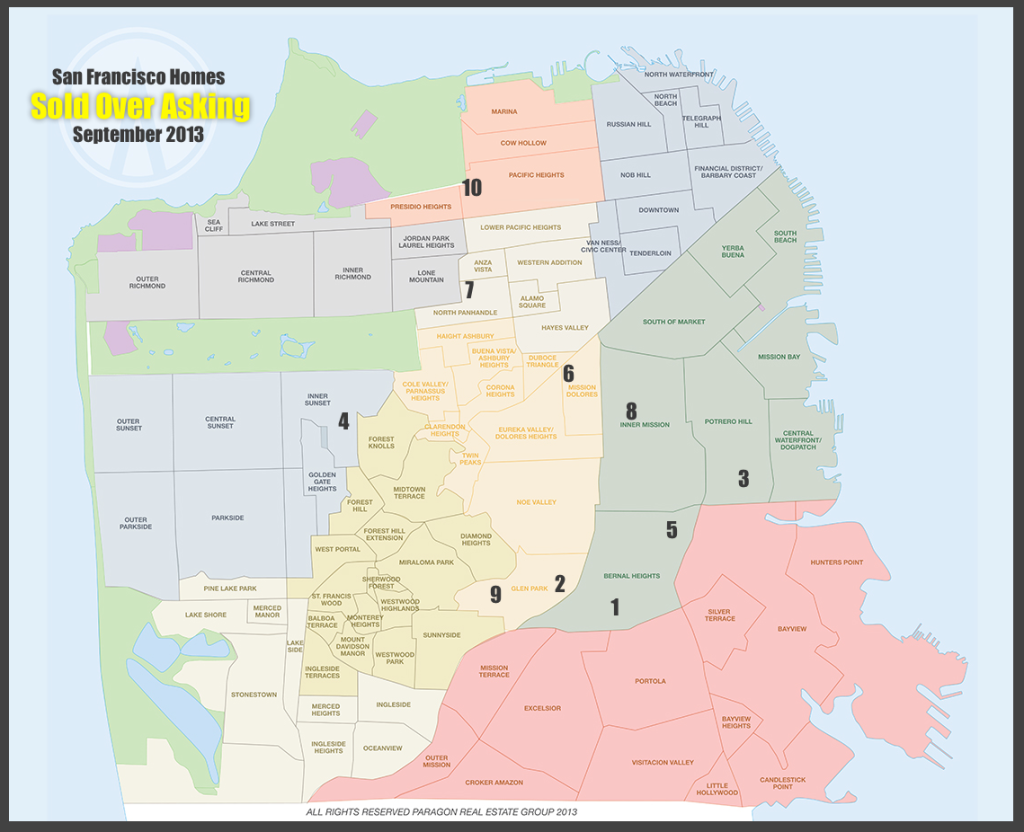
Over Asking in September-Examples

Ten San Francisco Homes That Sold Over Asking in September

| # | Date | Days on Market | Neighborhood | Property Type | Address | Beds | Baths | Price | Sales Price as a % of the Original Price |
|---|---|---|---|---|---|---|---|---|---|
| 1 | 9/6/13 | 8 | Bernal Heights | SFD | 324 Highland | 3 | 1 | $1,112,000 | 146.51 |
| 2 | 9/13/13 | 28 | Glen Park | SFD | 12 Addison Street | 3 | 2 | $1,312,000 | 145.94 |
| 3 | 9/20/13 | 13 | Potrero Hill | SFD | 837 Wisconsin | 2 | 1 | $1,301,000 | 144.72 |
| 4 | 9/25/13 | 20 | Inner Sunset | SFD | 1566 9th Avenue | 4 | 2.25 | $1,395,000 | 142.35 |
| 5 | 9/4/13 | 38 | Bernal Heights | SFD | 3025 Cesar Chavez | 3 | 2.5 | $1,050,000 | 140.19 |
| 6 | 9/13/13 | 29 | Mission Dolores | Condo/Coop/TIC/Loft | 161 Dolores Street #3 | 1 | 1 | $580,000 | 138.42 |
| 7 | 9/12/13 | 55 | North Panhandle | SFD | 2133 Golden Gate Avenue | 3 | 1.5 | $1,105,000 | 138.30 |
| 8 | 9/17/13 | 10 | Inner Mission | SFD | 837 South Van Ness | 5 | 1 | $1,901,000 | 136.27 |
| 9 | 9/9/13 | 22 | Glen Park | SFD | 37 Elk Street | 3 | 2 | $1,282,000 | 135.09 |
| 10 | 9/27/13 | 12 | Pacific Heights | SFD | 2201 Lyon Street | 6 | 3.5 | $5,250,000 | 134.79 |
All data from sources deemed reliable, but may contain errors and is subject to revision.
Homes as Investments

Home Prices, Inflation, Leverage & Home Equity
Paragon Real Estate Report, October 2013
First and foremost, any home purchased needs to work as a home: it fulfills your housing needs at an affordable monthly cost – ideally, a cost, after tax deductions and principal pay-down, less than or similar to that of renting the property. However, though it cannot be compared on an apples-to-apples basis to investments such as stocks, bonds and CDs (that you don’t live in), it’s worth looking at the issue of homeownership as a financial investment as well.
If you increase your screen-view zoom to 125%, the charts will be easier to read.
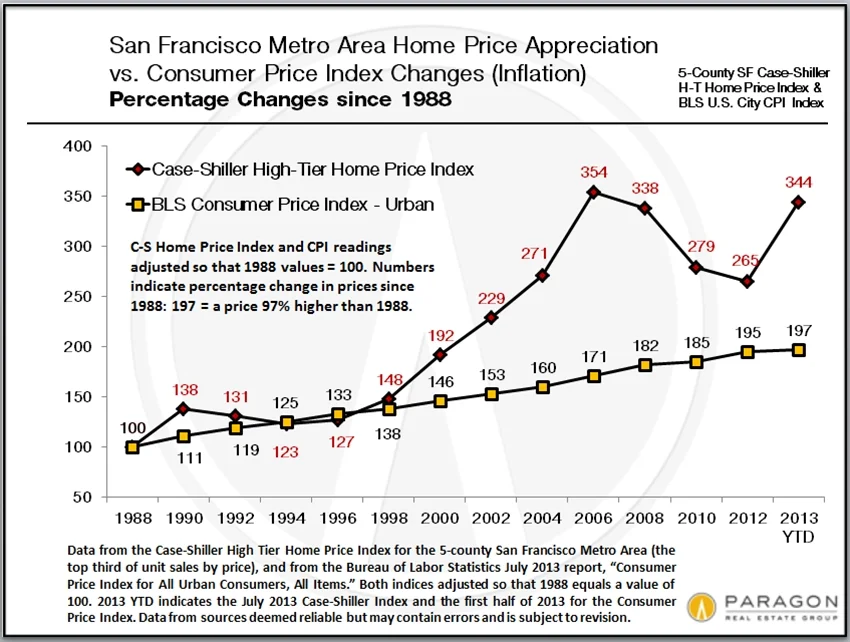
 This chart compares, over 25 years, the amount of inflation per the Consumer Price Index (CPI) to price appreciation for high-price-tier homes in the 5-county San Francisco Metro Area per the Case-Shiller Index. (Most of the City of San Francisco’s housing is in the high-price tier, the upper third of Bay Area unit sales.) In this chart, 1988 equals a price-value of 100; 127 equals a price 27% higher than the price in 1988 for the same goods or house. CPI inflation is relatively slow and steady: the average across the past 25 years is a little less than 3% per year. Home prices, however, jump dramatically up (appreciation) and down (depreciation) depending on the market cycle, but average appreciation from 1988 to mid-2013 was about 5% per year – though this calculation can vary greatly by the exact start and end dates chosen.
An average SF Metro Area home purchased in 1988 appreciated by 244% as of July 2013, while the overall CPI inflation rate was 97%. If the home had been sold at the recent bottom of the market, the difference would have narrowed to 165% appreciation vs. 95% inflation. Purchase and sell timing always matters and if one has to sell at the bottom of the market, it affects the return on any investment. As the chart illustrates, home-price appreciation usually outpaces inflation by a significant margin over the longer term: this is a good thing for homeowners and doesn’t include other benefits such as living in the property and the capital gains exclusion on the sale of a principal residence.
This analysis applies well to homes purchased with all cash and no financing. Leverage alters the picture substantially.

If one leverages one’s home purchase by taking out a loan, then the growth in one’s home equity dramatically outpaces inflation over the longer term. For the sake of simplicity, in the example above, we’ll assume that home price appreciation and inflation both run at 3% per year, and that the buyer put down 20% in cash plus closing costs, and financed the remaining 80% with a 30-year fixed rate loan. In this scenario, each year that the inflation/ home appreciation rate is 3%, one’s home equity asset grows by about 15%, plus the principal repayment on the outstanding loan (which is a major component – like a forced savings account – in the growth of equity over time). Indeed, the higher the inflation rate, the greater the equity growth. If home price appreciation outpaces inflation as well – as it has over the past 25 years – that accelerates the increase in home equity further. Moreover, the financing cost is currently subsidized by the mortgage interest tax deduction, if that applies to your financial situation.
This is why, using reasonable leverage, real estate is typically considered a good long-terminvestment – short-term can be much riskier – as well as an excellent hedge against inflation. Of course, if leverage is abused as it was in the years of subprime lending, underwriting standards decline, predatory lending and home-refinancing frenzy (i.e. "using one's home as a piggy bank"), other risks arise.
In earlier times, when people didn’t move around as much, one bought one’s home, paid it off over the years and when retirement came, had a home owned free and clear – a huge financial asset to be used as appropriate.

In this chart, the increase in the annual cost of homeownership with a fixed-rate loan is compared with the increase in rent at a 3% inflation rate, and the increase in rent of a home subject to San Francisco rent control, where annual rent increases are limited to 60% of CPI. As seen, if one locks in a fixed mortgage interest rate, the increase in ownership cost is limited to the increase in property tax costs (limited under Prop 13) and maintenance expenses, while the entire rental cost may be subject to annual raises. Over the longer term, one’s ownership costs become more and more attractive when compared to rental housing costs subject to inflation. If one owned the home for the full 30-year loan period, the monthly mortgage payment itself would disappear.
We have generated two sample rent vs. buy scenarios for San Francisco here:
2-BR Apartment Rental vs. Condo Purchase and 3-BR House Rental vs. Purchase
And you can perform your own rent vs. buy scenario calculations here, using your own financial circumstances, assumptions and projections: Rent vs. Buy Calculator
Important caveats: Trying to compare buying a home to other financial investments on an apples-to-apples basis is impossible, because there are so many other variables at play: the use and enjoyment of the home, how the cost of homeownership compares to renting, physical condition decline over time (without further investment), risks and returns on other types of investments, home tax deductions, the capital gains exclusion on profit from a principal residence sale ($250k for single owner/ $500k for couple), market timing and other factors. All the analyses above are simply sample scenarios, looking at homeownership from a number of angles using a variety of assumptions. It is unknown whether they will apply to future trends.
As said in the first line of this report, first and foremost, any home purchased needs to work as a home: it fulfills your housing needs at an affordable monthly cost. If that’s where you start, with a fixed rate loan, and you don’t refinance out growing home equity, and you don’t have to sell during a market downturn (which, admittedly, isn’t always possible to avoid), then you should come out all right and more often, very well.
Bubbles, Busts and Booms in San Francisco

Surprisingly consistent: Over the past 30+ years, the period between a recovery beginning and a bubble popping has run approximately 6 years, which is not really much time to go from a negative market outlook to "irrational exuberance." We are currently something less than 2 years into the current recovery. Periods of market recession/doldrums following the popping of a bubble have typically lasted about 4 years. Generally speaking, within about 2 years of a new recovery commencing, previous peak values (i.e. those at the height of the previous bubble) are re-attained -- among other reasons, there is the recapture of inflation during the doldrums years. In this current recovery, those homes hit hardest by the subprime loan crisis -- typically housing at the lowest end of the price scale in the less affluent neighborhoods, which experienced by far the biggest bubble and biggest crash -- may take significantly longer to re-attain peak values (see the fifth chart down), but higher priced homes are already doing so. These general timelines of recession, recovery, bubble and market adjustment (or crash) can be discerned in the longer-term charts below. However, this does not mean that these recurring time periods necessarily reflect some natural law in housing market cycles, or that they can be relied upon to predict the future.
(After Recession) Boom, Decline, Doldrums

In the above chart, the country is just coming out of the late seventies, early eighties recession – huge inflation, stagnant economy (“stagflation”) and incredibly high interest rates (hitting 18%). As the economy recovered, the housing market started to appreciate and this surge in values began to accelerate deeper into the decade. Over 6 years, the market appreciated almost 100%. Finally, the eighties version of irrational exuberance -- junk bonds, stock market swindles, the Savings & Loan implosion, as well as the late 1989 earthquake here in the Bay Area -- ended the party.
Recession arrived, home prices sank, sales activity plunged and the market stayed flat for 4 years. Still, even after the decline, home values were 70% higher than when the boom began in 1984.
1996 to Present
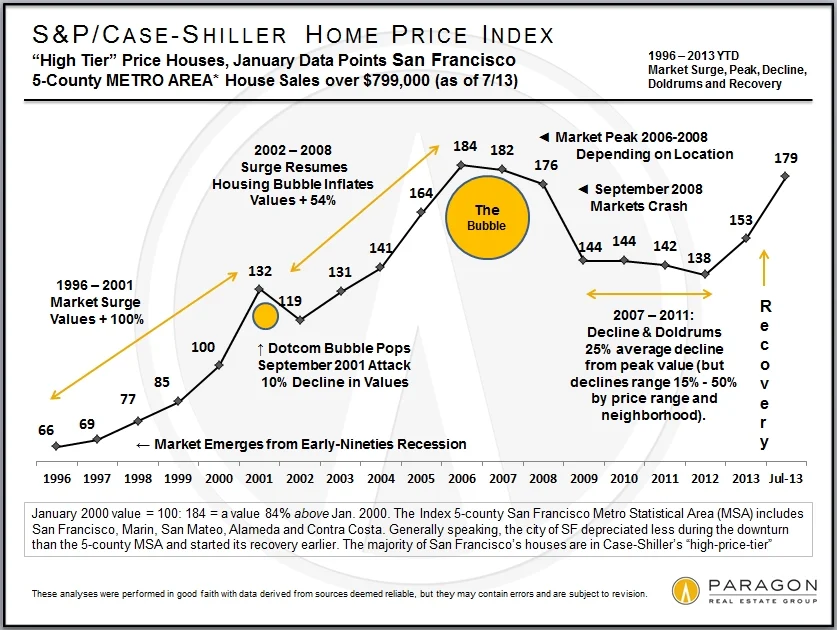
(After Recession) Boom, Bubble, Crash, Doldrums, Recovery

This next cycle looks similar but elongated. In 1996, after years of recession, the market suddenly took off and became frenzied -- similar to what we’re experiencing today. The dotcom bubble pop and September 2001 attacks created a market hiccup, but then the subprime and refinance insanity, CDOs and derivatives, Ponzi schemes, books titled “Dow 30,000” and claims that real estate never declines, super-charged a housing bubble. From 1996 to 2006/2008, the market went through an astounding period of appreciation. (Different areas hit peak values at times from 2006 to early 2008.) In September 2008 came the market crash.
Across the country, home values fell 15% to 60%, peak to bottom, depending on the area and how badly it was affected by foreclosures -- most of San Francisco got off comparatively lightly with declines in the 15% to 25% range. The least affluent areas got hammered hardest by distressed sales and price declines; the most affluent were typically least affected. Then the market stayed flat for more than 3 years, albeit with a few short-term fluctuations.
San Francisco from 2010 to 2013
A Strong Recovery in Process

In 2011, San Francisco began to show signs of perking up. An improving economy and growing buyer demand coupled with a low inventory of listings began to put upward pressure on prices. In 2012, as in 1996, the market abruptly grew frenzied with competitive bidding. The city’s affluent neighborhoods led the recovery, and those considered particularly desirable by newly wealthy, high-tech workers showed the largest gains. However, virtually the entire city is now experiencing a high demand-low supply dynamic and the resulting rapid price appreciation.
The SF median house sales price increased dramatically in 2012 and then accelerated further in the first half of 2013, though varying by neighborhood. By all appearances, San Francisco and the Bay Area are in the midst of a very healthy recovery, though the economy always remains susceptible to big financial/political crises. New home construction is rising very dramatically, distressed sales are declining dramatically, the rent vs. buy equation has turned favorable to buying, interest rates are still relatively low (despite their recent spike in summer 2013) and general economic conditions seems to be continuing to improve.
The 1983 – 2013 Overview
Up, Down, Flat, Up, Down, Flat...Up

Smoothing out the bumps delivers this overview for the past 30 years. Whatever the phase of the cycle, up or down, while it’s going on people think it will last forever: Every time the market crashes, the consensus becomes that real estate won’t recover for decades. But the economy mends, the population grows, people start families, inflation builds up over the years, and repressed demand of those who want to own their own homes builds up. In the early eighties, mid-nineties and in 2012, after 3-4 years of a recessionary housing market, this repressed demand jumps back in (or "explodes" might be a good description) and prices start to rise again. It's not unusual for a big surge in values to occur in the first couple years after a recovery begins.
Bay Area Bubble, Crash & Recovery by Price Range

This chart illustrates the huge differences in the degree of value increases and declines experienced by different price segments of single-family housing in the Bay Area: The lower the price range, the more it was affected by subprime lending, which created the bigger bubble; this led to a much larger percentage of foreclosures and distressed sales and a much more dramatic crash. San Francisco, with its expensive housing, suffered less than most places, though it still certainly suffered. Distressed sales never made up the huge percentage of sales they reached in other counties, and now, with the market rebound, distressed-home listings in SF have virtually disappeared and are rapidly declining everywhere.
Very generally speaking, the more affluent areas of the city saw a peak-to-bottom decline in the 15% to 20% range; the city’s middle price range saw 15% to 25% declines; and its lowest price segment went down 25% to 40%. (Some of the other areas of the Bay Area and country saw much larger declines as seen in the chart above.) The city is now seeing a rapid reversal of those declines - indeed some neighborhoods (as of summer 2013) now appear to be hitting or even exceeding the values of the previous peak of the San Francisco homes market in 2007-2008. It's still a bit early to make definitive conclusions, since values fluctuate for a number of reasons, including seasonality.

The Autumn Selling Season-September 2013 Market Update
The Autumn Selling Season, Seasonality & Changing Market DynamicsSeptember 2013 San Francisco Real Estate Market Report
Is the market flattening out after its huge appreciation surge since 2012 began, or will the autumn sales season bring another step of renewed price increases? Right now, there are some mixed signals regarding what is occurring in the San Francisco market: spring's big jump in values vs. the recent plateau in median sales prices; interest rates that have increased significantly, but are still extremely low by historical measures; growing signs of buyer burnout with frenzied market conditions vs. supply and demand statistics that still indicate a very strong sellers' market; and an increasing number of expired listings, which suggests that sellers may now be pushing their asking prices too high for buyers to swallow. Seasonality plays a significant role in median sales prices rising in spring and autumn, and declining in summer and winter - as discussed below, much of this pertains to ebbs and flows in the luxury home market and does not necessarily reflect changes in home values. With real estate statistics, the longer-term trend is what is meaningful, not short-term fluctuations up and down. Looking at the chart above, the median sales price jogs up and down for a variety of reasons, including seasonality, but stepping back, one sees the strong, ongoing appreciation since the market recovery began. September is typically the month with the highest number of new listings hitting the market: how buyers respond will determine what the next stage of the market will look like. |
||||||||||||||||||||||||
|
||||||||||||||||||||||||


Have SF Home Prices Plateaud?

Are San Francisco Home Prices at a Plateau?
Is the San Francisco homes market on the cusp of a change and starting to experience a lessening in its ferocious, red-hot heat? Are buyers finally pushing back at the relentless increase in prices we have been experiencing in the city?

- The San Francisco Median Home Sales Price has leveled off, dropping somewhat from an April-May peak. (chart above)
Charts below:
- Buyer demand is still extremely high as measured by Percentage of Listings Accepting Offers.
- Inventory is still extremely low as measured by Months Supply of Inventory and Units for Sale.
- The number of Expired & Withdrawn listings climbed in July and was about 19% higher than July of 2012 (though less than half the number of July 2011). The main reason why listings expire or are withdrawn from the market is that buyers have concluded they are priced too high.
- The July Market Snapshot overview still indicates a very hot market by any reasonable measure. However, offers being negotiated now won't typically close escrow and show up in the sales statistics for 6 to 8 weeks. To a large degree in real estate, we are always looking in the rearview mirror.
- Mortgage interest rates, while having risen relatively dramatically from spring's historic lows, are still extremely low by any other measure.


An uptick in expired and withdrawn listings could be an early indication of buyers walking away from listings they feel are just too highly priced.

Looking at the July snapshot showing that 87% of sales sold without a price reduction at an average of 7% over list price makes it clear the market is still very hot, even if it may be on the cusp on a transition to a somewhat less fevered state.


Rent vs Buy- 3 Bedroom House

Rent vs Buy - San Francisco 3-Bedroom House
Please Note: Rent vs. buy calculations can be performed a wide variety of ways, and results will depend on your own financial circumstances and economic projections. The below calculations represent simply one scenario.
This rent vs. buy analysis compares the cost of buying a San Francisco 3-bedroom house at the June 2013 median sales price of $1,050,000 – adjusting for tax deductions and principal pay-down of the mortgage – with the cost of renting an SF 3-bedroom house or apartment at the June 2013 average asking rent of $4500/month (per MyApartmentMap.com).
Assumptions: approximate 20% down-payment; 30-year fixed-rate loan at an APR of 4.5%; and closing costs; property taxes; ongoing insurance and maintenance costs; annual inflation and home appreciation rates - all at what seem to us to be reasonable projections. We've also used a combined income tax rate of 25% for the mortgage interest deduction. But especially when projecting for long periods of time, many of these figures are simply guess-timates. You may perform calculations based upon your own financial situation and projections here:
The following may be easier to read if you adjust your screen-view zoom to 125%. In Windows systems, this can be done by pressing the Control and + keys simultaneously.


Heat Map Report


This heat map compares 2013 2nd quarter or 1st half median home sales prices – for houses, condos, co-ops and TICs combined, as reported to MLS – with those at the peak value time prior to the recent market recovery. Previous peak value times vary by neighborhood: typically, the least affluent neighborhoods hit peak prices in 2006 and also fell the most, percentage-wise, during the crash, falling 25% to 50%. These neighborhoods were most affected by the subprime and distressed-property sales crises. The mid-affluent neighborhoods peaked in 2007, and usually declined in value in the 20% to 25% range. And the most affluent areas reached peak values last, in the first-half of 2008 prior to the September 2008 crash: Their fall in value ranged approximately 15% to 20% from 2008 peak to 2010-2011 nadir.
Generally speaking, when the market began to turn around in late 2011/early 2012, the last neighborhoods to fall were the first to recover, followed by the mid-affluent and then the less affluent areas. All the city’s neighborhoods have made dramatic recoveries through the second quarter of 2013, but some have surged far above previous peak median sales prices and they are the red and orange colored zip codes on the map: South Beach and Yerba Buena (94105), Inner Mission and Bernal Heights (94110), the greater Noe Valley- Eureka Valley-Cole Valley area (94114 & 94117) and perhaps some of the old-prestige, northern neighborhoods (whose data is less definitive). Ochre and yellow delineate smaller increases over previous peak prices, 5% - 12%. The light-green areas, such as most of the Sunset, Parkside and Richmond districts, are back in the general range of their 2007 peak values, maybe a tad over. And the southern, blue-tinted neighborhoods are still 10% to 25% below their 2006 prices (but, like other areas, rising rapidly). Bayview (94124) is furthest below its peak, but then, with about a 50% decline, it saw the steepest drop in the city, market peak to market bottom.
Zip codes mapped white signify there wasn’t enough dependable data for a reliable analysis.
There are two different reasons for the large disparities between the zip codes: the first is that some neighborhoods are experiencing particularly white-hot buyer demand, especially by affluent high-tech buyers. The second reason is that different neighborhoods have greater amounts of decline to recoup. Those neighborhoods which declined the most in value simply have more ground to make up to get back to where they were before the market crash.
Note that if a property declined in value by 50%, it then has to go up in value 100% to get back to where it was: percentage decreases and percentage increases are not created equal.
According to Case-Shiller, the upper third of unit sales, over $760,000, is getting close to or has again reached peak values (or, in the case of San Francisco, surpassed their peaks), so significant portions of affluent Marin and San Mateo counties would be green or close to green. Marin and San Mateo have lately been trading the title for the California county with the highest median home sales price, with May-June medians of about $1,000,000. (San Francisco’s median price is pulled down somewhat by its large percentage of condo/TIC sales. Looking just at SF house prices, the overall median price in the second quarter was about $997,000 – but there are huge variations by neighborhood, ranging from under $500,000 to $4,000,000.)
And in the most sought-after communities in the heart of Silicon Valley, such as Palo Alto, there would probably be pockets of yellow-orange. Unfortunately, our access to historical sales data there is not as easy or comprehensive as we would prefer, but that is our best guess.
Our most recent Case-Shiller Index report, with price charts, can be found here: San Francisco Metro Area Case-Shiller Index
Though the rebound in home prices is occurring virtually everywhere in the country, San Francisco has been at the leading edge of the turnaround. Generally speaking, the city peaked in value last, recovered first and is rebounding most dramatically.
- This link goes to our recent report on White-Hot SF Districts, but note that its analyses are notcorrelated to zip codes, are specific to a single property type (house or condo), and may compare different time periods than the map above: 5 White-Hot Districts in a Red-Hot Market
- For comparative home values throughout the Bay Area and within San Francisco by neighborhood: Bay Area Mapped Home Values
Important Issues Regarding This Analysis The median home price is that price at which half the sales occurred for more and half for less. Median prices can and often do fluctuate due to other factors besides changes in value, such as inventory available to purchase, seasonality, the ratio of house to condo/TIC sales, and major changes in the distressed and luxury property segments. (All these factors apply to our sales in spring 2013.) Zip codes, which were convenient for mapping, often contain neighborhoods of widely different values and market conditions – for example, 94115 includes both Pacific Heights and Western Addition; 94118 includes Presidio Heights and Inner Richmond – thus their overall statistical result is a grab-bag blend that may not reflect the market situation throughout the zip code. Some areas have many fewer sales than others – such as 94133 (North Beach, Telegraph Hill) – and the fewer the sales, the less reliable the statistics. For all these reasons and others that pertain to any statistical analysis of large numbers of relatively unique home sales with sometimes huge disparities in size, desirability of location, quality and price point, everything about this analysis should be considered approximate, with reasonable margins of error. How it applies to any particular property is unknown without a specific comparative market analysis crafted to its circumstances.
SF Transportation Statistics

San Francisco Transportation Statistics
Our favorite fact learned from the MTA report is that there is a specific citation for "driving through a parade" -- hopefully performed very slowly and carefully. And we suppose a terrific number of unmanned cars must be rolling down our hills like golf balls, because there were 65,000 tickets issued for not curbing one's wheels on an incline.


Rent vs Buy- 2 Bedroom Condo
Rent vs Buy - San Francisco 2 Bedroom Condo
Please Note: Rent vs. buy calculations can be performed a wide variety of ways, and results will depend on your own financial circumstances and economic projections. The below calculations simply represent one scenario.
This rent vs. buy analysis compares the cost of buying a San Francisco 2-bedroom condo at the June 2013 median sales price of $900,000 – adjusting for tax deductions and principal pay-down of the mortgage – with the cost of renting an SF 2-bedroom apartment at the June 2013 average asking rent of $4000/month (per MyApartmentMap.com).
Assumptions: 20% down-payment; 30-year fixed-rate loan at an APR of 4.5%; and closing costs; property taxes; ongoing insurance and maintenance costs; annual inflation and home appreciation rates - all at what seem to us to be reasonable projections. We've also used a combined income tax rate of 25% for the mortgage interest deduction. But especially when projecting for long periods of time, many of these figures are simply guess-timates. You may perform calculations based upon your own financial situation and projections here:
The following may be easier to read if you adjust your screen-view zoom to 125%. In Windows systems, this can be done by pressing the Control and + keys simultaneously.


All Cash Buyers

All Cash Home Sales in San Francisco

In most of the country, the first group, investors, dominate all-cash purchases, even though their percentage of sales is now falling with the market recovery and general decline in the number of distressed property sales everywhere. In San Francisco, with its affluent (and sometimes super-affluent) buyer profile and its ferociously competitive market, all-cash purchases are dominated by the second and third categories. Some of these purchases run in the many millions or even tens of millions of dollars. And since San Francisco never suffered from the distressed property crisis as much as other areas, investor purchases of such homes never made up the large percentages of sales seen elsewhere (though we do have a fair number of contractors looking for fixer-upper and tear-down-and-build-new opportunities). Now distressed home sales are on the verge of disappearing altogether in the city: The percentage of distressed home sales in San Francisco peaked at about 20% a couple years back and is now down to a negligible 4% (generally clustered in the least affluent neighborhoods). However, in many other areas of the Bay Area, state and nation, the percentage peaked at over 50% or 60% of sales and has now declined to a much reduced but still considerable 20% - 30% of sales.
© 2013 Paragon Real Estate Group
The Heat in San Francisco-August 2013 Market Report
Heat Map of San Francisco Median Home Price ChangesPercentage Changes since 2006-2008 Peak of Market Range from 25% Below to 25% Above Previous Peak Values August 2013 Market Report
This heat map compares 2013 2nd quarter or 1st half median home sales prices - for houses, condos, co-ops and TICs combined - with those at the peak value time prior to the recent market recovery. Previous peak value times vary by neighborhood: typically, the least affluent neighborhoods hit peak prices in 2006 and also fell the most, percentage-wise, during the crash, falling 25% to 50%. These neighborhoods were most affected by the subprime and distressed-property sales crises. The mid-affluent neighborhoods peaked in 2007, and usually declined in value in the 20% to 25% range. And the most affluent areas reached peak values last, in the first half of 2008 prior to the September 2008 crash: Their fall in value ranged approximately 15% to 20% from 2008 peak to 2010-2011 nadir. Generally speaking, when the market began to turn around in late 2011/early 2012, the last neighborhoods to fall were the first to recover, followed by the mid-affluent and then the less affluent areas. This link goes to our full report and an explanation of the analysis: Heat Map Report |
||||||||||||||||||||||||
|
||||||||||||||||||||||||


Parking in San Francisco

San Francisco Home Sales by Parking

The vast majority of San Francisco home sales include at least one on-site parking space in the sale, and 80% - 90% of buyers put parking on their must-have list when searching for a new home. That doesn’t mean that a home without parking cannot sell at a good price, but it does mean that on average it will take somewhat longer to sell, as well as selling at a lesser price than a comparable home with parking. As always, correct pricing is critically important, as well as all the other issues pertinent to finding the right buyer for any particular property, such as preparation and marketing.
It’s difficult to calculate the exact value differential between homes with and without interior, on-site parking, because the data set of no-parking sales is relatively small and scattered in many different micro-markets in the city. Also, for houses in particular, properties without parking are almost always late 1800’s Victorians, which skews the analysis. Condos are little more complicated, because condos without parking range from Victorian and Edwardian flats (usually lower level units of buildings that have less than a 1 to 1 ratio of parking spaces to units); to modern pied-à-terres near urban cultural districts, perhaps with valet parking services available; to brand new condo projects specifically targeted at younger, non-car-drivers. But ball-parking the difference in value between two comparable homes with and without parking, we’d estimate the difference to be in the 10% - 12% range; an experienced San Francisco appraiser we consulted also estimated in the 10% range.
But in real estate, the devil is always in the details. If there is long-term leased parking or a public parking garage available very close by, or if street parking is particularly easy in the neighborhood, that would typically lessen the price disparity. Interior, garage parking is worth more than an outside pad. For condos and TICs, side-by-side is more valuable than tandem parking, and for condos, deeded is worth more than leased parking. (Many new buildings lease out there on-site parking spaces instead of deeding them to the condo itself.) A larger space is preferable to a smaller - every year, a few buyers are very unhappy to find out that their SUVs are too tall for the angled driveways and garage openings of older houses or too large to maneuver into their assigned parking spaces in a condo building. (As part of your due diligence, always insist on parking your car in the property during the inspection period.) Or the listing agent mistakenly points to the wrong parking space in the garage: always compare what the CC&Rs or TIC Agreement documents say and what the parking "map" delineates to the space pointed out. All things being equal, having more than 1 parking space would of course increase property value, but not to the degree of that first space.
Victorian and Edwardian Architecture in SF-With Pics!
|
Victorian & Edwardian Architecture in San Francisco
The text, chart and photos are all courtesy and permission of the San Francisco architect James Dixon: James Dixon Website. We are most grateful for his generosity in allowing us to use them. |
||||||||||||||||||||||||||||||||||||||||||||
|
||||||||||||||||||||||||||||||||||||||||||||
|
This link goes to architect James Dixon's complete overview, which was the basis for this article. It features short videos on each of the different Victorian and Edwardian styles mentioned above. Also included is a link to his overview of subsequent styles of San Francisco architecture: James Dixon on San Francisco Victorian and Edwardian Architecture James Dixon on San Francisco Architecture 1920 to Present And for those who find San Francisco history as interesting as we do, here are two other websites we've discovered filled with fascinating stories and photographs: |
||||||||||||||||||||||||||||||||||||||||||||


Luxury Homes Update
San Francisco Luxury Home Sales Soar
In San Francisco, no market segment has recovered as dramatically as that for high-end homes. There are a number of reasons for this: the general economic recovery, the huge local increase in high-tech wealth, an increase in the number of highly affluent foreign buyers, and the fact that, as a group, the affluent have profited most from the large rebound in stock market values in recent years. And then the general appreciation the city has experienced of 20% - 30% since 2011 has simply moved a lot of sales into a higher sales price category. Whatever the reason, there is an enormous amount of money sloshing around the Bay Area that is now being invested in homes—many of which are being purchased all-cash. At Paragon, we have seen an increase of over 100%, year over year, in the number of luxury home sales we have brokered so far in 2013.
In the first chart below, we are defining luxury homes as condos, co-ops and TICs selling for $1,500,000 and above (the vast majority of these are condo sales), and houses selling for $2,000,000 and above. These are relatively arbitrary thresholds since a $2,000,000 house in Presidio Heights can be a small-ish fixer-upper, while a home of that price in another neighborhood might be a pristine mansion. In the charts breaking down sales by neighborhood, we’ve added the price segment for houses of $1,500,000 to $2,000,000 since what is happening there is quite interesting as well.

San Francisco High-End Home Sales by District & Neighborhood
The first chart is for condo, co-op and TIC sales, and the three following are for house sales.


The neighborhoods listed are representative of one of the 10 Realtor Districts for San Francisco, so consider them as indications of the general area where the sales occurred. This analysis tracks sales reported to San Francisco MLS. A fair number of high-end homes sell “off-market” and are not reported, however we don’t believe these alter the general picture painted in the charts above.
© 2013 Paragon Real Estate Group
Overheated? Yes. Bubble? No. Stabilizing....Maybe.
|
Overheated? Yes. Bubble? No. Stabilizing? Maybe.
Many adjectives are used to describe San Francisco, but normal isn't a common one - and the same can be said about our real estate market. Even taking into account its tendency to be unusual in one way or another, this past spring's market was overheated by virtually any definition. Surging consumer confidence and huge buyer demand chased a deeply inadequate supply of homes for sale, abetted by interest rates so low that loans - factoring in inflation and mortgage interest deduction - were almost like free money. All this led to an extreme seller's market, a feeding frenzy and dramatic price appreciation. But not, in our opinion, a bubble. The Economist, one of the first to sound the alarm for the last bubble, sees no sign of a U.S. housing bubble, basing its conclusion upon historical comparisons of home prices with rents and incomes. Also, it is not unusual for the market to go somewhat crazy following a 4-5 year down cycle after all the repressed demand bursts forth - this happened in 1996-1997 too. Besides which, we are only about 18 months into the current recovery. Though real estate is susceptible to sudden economic and political shocks, in past cycles, recoveries have typically lasted at least 6-8 years before peaking. That doesn't mean there won't be any short-term market adjustments, up or down, for one reason or another, along the way. There are some signs of a normalizing market. After a year of declines, the number of new listings in the 2nd quarter was a little higher than the 2nd quarter of 2012. Though this inventory was quickly gobbled up and overall supply remains very low, it's a good sign more sellers are entering the market. Median prices may be leveling off after spring's big pop - it's still too soon to be sure, but summer often sees a cooling down. It's not welcome news to buyers, but interest rates have increased from extreme lows - though remaining very low by any historical scale. (See below: The Sky is Not Falling.) The distressed home segment, which always distorts markets, is disappearing in the city and declining everywhere. And new-home construction continues to increase: even though we won't see much of this new inventory until 2014 and later, it's a very positive sign. We have updated our home value maps to reflect spring's recent sales: San Francisco Neighborhood Values |
||||||||||||||||||||||
|
||||||||||||||||||||||


SF Neighborhoods Hit New Peak Values
San Francisco Neighborhoods Hit New Peak ValuesParagon Market Report, June 2013New highs in home prices have not yet been reached in every San Francisco neighborhood, but the majority has either regained the value lost since the 2008 market meltdown, or now exceeded the previous high points of 2006-early 2008. (Different neighborhoods peaked at different times, just as they are now recovering at different speeds). This does not mean that every property bought at the height of the bubble in feverish multiple-offer bidding wars has now regained peak value. Nor does it mean that values might not fluctuate or drop in future months due to seasonal and/or other economic factors. Though virtually every market in the country is now on a similar upward trajectory, San Francisco's has recovered more quickly than most in the Bay Area, state and country. The city's neighborhoods, with a few exceptions, were never hit as hard as most other areas by the tsunami of distressed property sales: our home values generally fell in the 15-25% range compared to huge declines of 40-60% elsewhere and so we have had less ground to recover. That said, the city has always been an exceptional real estate market and the confluence of economic factors both general (such as the lowest interest rates in history) and unique (such as the local, high-tech boom) jumpstarted and supercharged our recovery beyond most others. It should be noted that, looking at past recoveries in the early eighties and mid-nineties, it is not unusual once a recovery gets underway after years of recession and repressed demand, for the market to regain previous peak values within a couple years of the turnaround beginning. Recoveries often start with a dramatic surge and that is what has happened with this one. In this chart, one can see the recovery occurring everywhere, but most dramatically in San Francisco. For this analysis, we've calculated the 2013 SF median house sales price for the 5 months since the year began; if we looked at just the last 3 months (reflecting offers accepted in 2013, when the market accelerated further), the SF median house price jumps to about $1,000,000. (Note: State and national data sources are behind those we can access for the city, and the last median prices reflect that disparity.)
|
||||||||||||||||||||||||
|
||||||||||||||||||||||||


