The Autumn Selling Season-September 2013 Market Update

August-2013_Snapshot1.jpg

The Autumn Selling Season, Seasonality & Changing Market Dynamics

September 2013 San Francisco Real Estate Market Report

Is the market flattening out after its huge appreciation surge since 2012 began, or will the autumn sales season bring another step of renewed price increases?

Right now, there are some mixed signals regarding what is occurring in the San Francisco market: spring's big jump in values vs. the recent plateau in median sales prices; interest rates that have increased significantly, but are still extremely low by historical measures; growing signs of buyer burnout with frenzied market conditions vs. supply and demand statistics that still indicate a very strong sellers' market; and an increasing number of expired listings, which suggests that sellers may now be pushing their asking prices too high for buyers to swallow.

Seasonality plays a significant role in median sales prices rising in spring and autumn, and declining in summer and winter - as discussed below, much of this pertains to ebbs and flows in the luxury home market and does not necessarily reflect changes in home values. With real estate statistics, the longer-term trend is what is meaningful, not short-term fluctuations up and down. Looking at the chart above, the median sales price jogs up and down for a variety of reasons, including seasonality, but stepping back, one sees the strong, ongoing appreciation since the market recovery began.

September is typically the month with the highest number of new listings hitting the market: how buyers respond will determine what the next stage of the market will look like.

Paragon Real Estate Group

click for larger image
The Luxury Home Market, Seasonality & Median Sales Prices The big surge in accepted offers for higher-price homes occurs in April/May and September/ October, when these sales make up about 14% of total home sales. The big slump in luxury home sales occurs in the summer months and in December/January, when their percentage of total sales declines to about 10%: more so that the general market, the luxury segment checks out during the summer and winter holidays. This significant decline in the ratio of high-price sales to total sales is one factor that reduces overall median home sales prices during the summer and winter holiday months.
Paragon Real Estate Group

click for larger image
Inventory of Homes for Sale This chart tracks the overall decline in inventory available on any given day since the market recovery began. However, despite the huge decline in listings for sale on any day, the number of MLS home sales in 2013 YTD is actually a tad higher than the same period of 2012, and 16% higher than in 2011. Because a much higher percentage of listings are selling, and selling much more quickly than before. If sellers start re-entering the market in larger numbers, the quantity of sales should jump sharply higher as well - and may stabilize home price appreciation.
Paragon Real Estate Group

click for larger image
New Listings Coming on Market September is typically the single month of the year when the largest number of new listings comes on market. This chart illustrates the ebb and flow of new inventory by season. We shall see if this September brings the big surge in new home listings that buyers are hoping for.This link's chart tracks Months Supply of Inventory: It continues to indicate a market defined by very high demand when compared to the supply of inventory available to buy: Months Supply of Inventory
Paragon Real Estate Group

click for larger image
Expired and Withdrawn Listings The main reason for expired and withdrawn listings is that buyers ignored them as overpriced. The fact that the number of these listings has been climbing dramatically of late means that sellers are either pushing the envelope on prices or buyers are pushing back at the price points recently achieved during the height of the market frenzy - or both.
Paragon Real Estate Group

click for larger image
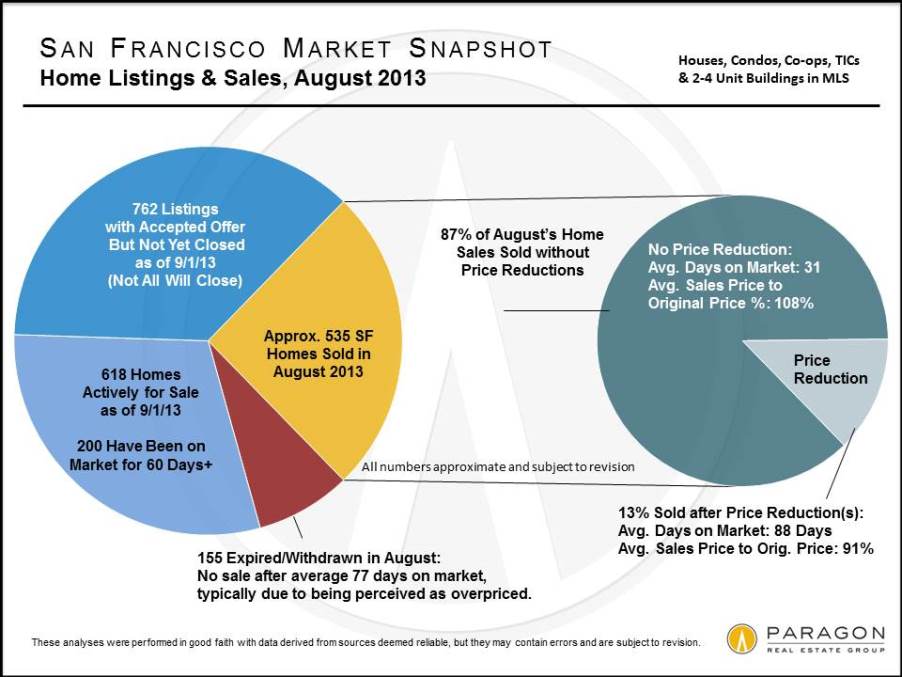
August Snapshot This chart indicates some of the mixed signals we're seeing: on one hand, 87% of sales sold quickly without price reductions at an average sales price 8% over list price (i.e. an extremely hot market). On the other hand, the number of listings expiring or being withdrawn is climbing and so is the number of listings that has been on the market for 2 months or longer without accepting offers. Note the large difference between average days on market between homes that sell without price reductions (31 days) and homes that must be reduced before they sell (88 days): pricing, preparing and marketing properly is vital in any market.
Paragon Real Estate Group

click for larger image
Mortgage Interest Rates Rates have been more or less stable since their big percentage jump in June. The increase in loan rates from their low point in 2013 is large as a percentage increase, but still leaves current rates very low from a historical perspective. The consensus of pundits seems to be that rates will be going significantly higher when and as the Fed begins tapering their huge bond-purchase program, but predicting interest rate changes is a tough game.
Previous
Previous

Bubbles, Busts and Booms in San Francisco

Next
Next

Condo Values in San Francisco