

Stay Up to Date on the East Bay Market

Your East Bay Events, Valentine's Edition
Love is in the air, and so is fun. Whether you're looking for a special night out with a loved one, throwing back a cold one with your buds, or munching on some tasty Girl Scout cookies, we've got your back.
|


Montclair Egg Shop
We love eating out, and a few years ago, slow and lazy brunches with bottomless mimosas were a part of most weekends. Now, with a toddler and an infant in tow, just getting out of the house can be a big production

The Montclair Egg Shop
Your Family Brunch Spot
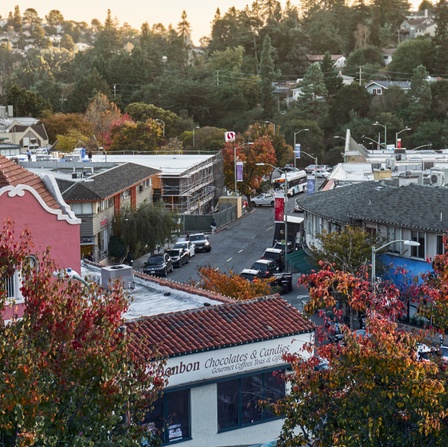
We love eating out, and a few years ago, slow and lazy brunches with bottomless mimosas were a part of most weekends. Now, with a toddler and an infant in tow, just getting out of the house can be a big production. Showing up to a restaurant and trying to squeeze a stroller between tables, apologizing for the inevitable spilled food on the floor, and trying to keep your child entertained so they don’t disturb other patrons can be downright exhausting. We’ll just eat at home, thank you very much. Luckily there are a few spots in the East Bay that make families feel invited and comfortable, and of those, the Egg Shop in Montclair Village is by far our family’s favorite. My two year old daughter loves it so much, she regularly walks around the house with a brown grocery bag draped over her shoulder, proudly announcing “I go Egg Shop now”.
The Egg Shop first opened in 1974 with multiple locations throughout Oakland. The Montclair Village location is the only remaining restaurant. The casual sit down spot is open for breakfast and lunch daily. It’s not unusual to find a line of patrons waiting outside for a table, but I’ve found that if you arrive before 9:30 you’re usually seated quickly on Saturdays. With the Montclair Village Farmer’s Market taking place every Sunday just a block away, arriving before 9am can help you avoid a wait then. The food is delicious and the staff are always welcoming and inviting to families. Booster chairs, high-seats, a kids menu, and crayons are on hand to make your meal that much easier. They strive for quick service and are always happy to bring out fruit or bread for the little ones to munch on while we wait for the rest of the order. Eggs do feature heavily here, with an estimated 300-400 eggs cooked up daily. My personal favorite dishes are a toss up between the Salsa de Montclair omelette and the Eggs Florentine. I’m a huge fan of poached eggs and hollandaise and usually judge a new brunch spot by how they pull of this classic breakfast staple. Egg Shop definitely tops my list on their execution. If you haven’t already given it a try, I definitely recommend stopping by. Bring the kids!
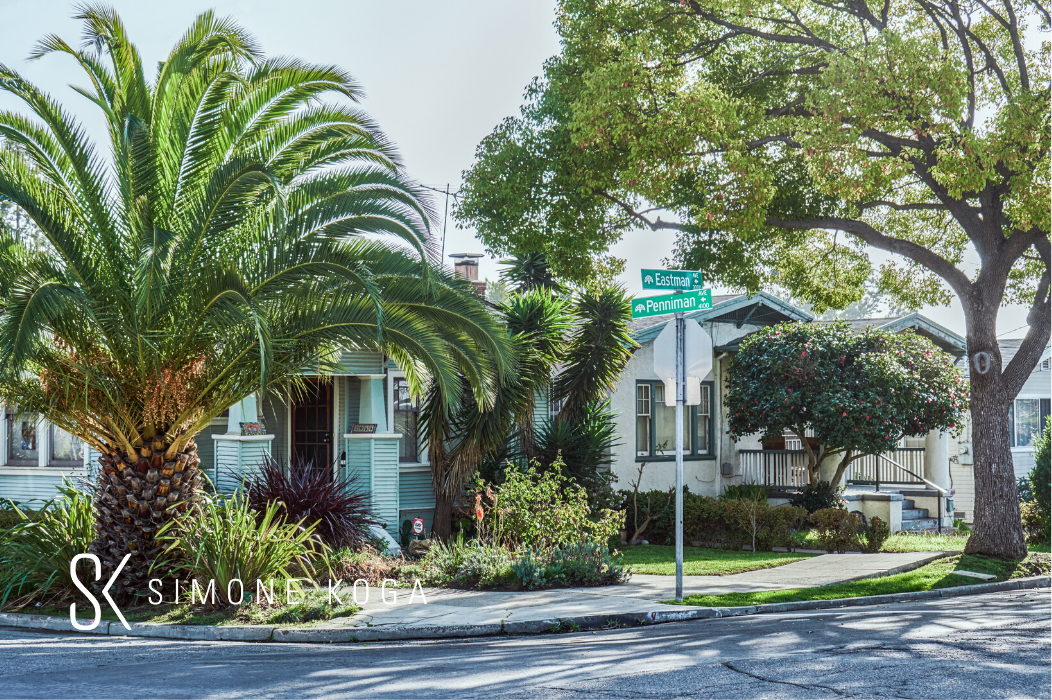
To learn more about the Montclair District, click here.

January 2020 East Bay Market Report
I don’t know about you but the start of each year always fills me with a lot of intense emotions. It’s always a blend of excitement, optimism, curiosity but lurking alongside is often a sense of...
|


December 2019 East Bay Market Report
By number of sales, Alameda County is the largest market in the Bay Area. The greater Oakland-Berkeley region constitutes the largest market within the county.
|

November 2019 East Bay Market Report
Using a six-month-rolling average of Alameda County monthly median sales prices smooths out monthly fluctuations to illustrate broad, long-term appreciation trends with more clarity.
|
October 2019 East Bay Market Report
Welcome Our Newest Team Member! Iniko Kaleo Koga joined the Simone Koga Group on October 9, 2019 at 12:56pm! 8lb, 4oz and 20.5 inches. It was a long journey, but everyone made it through beautifully.
|


September 2019 East Bay Market Report
After the slow doldrums of late summer, we’re seeing a flurry of activity kick off the Fall Market. September and October are often busy months as both sellers and buyers alike make their final efforts before the year winds to a close. If you’re thinking of making a change in your housing situation, let’s talk very soon to make sure we capitalize on the best time to make your dreams come true!
|
August 2019 East Bay Market Report
Remember that it's not only the "quality" of a location that affects dollar per square foot value, it's the size of the home: All things being equal (which they rarely are) smaller homes will sell for a higher dollar per square foot value than a larger one....
|

July 2019 East Bay Market Report
Stock markets hit new highs, interest rates hit multi-year lows, unicorn IPOs rolled out in San Francisco, and the greater Oakland-Berkeley real estate market had another very strong spring selling season...
|
June 2019 East Bay Market Report
The greater Oakland-Berkeley area is now actually out-performing Alameda County as a whole, but this is an excellent illustration of overall home-price trends since 1990.
|
May 2019 East Bay Market Report
With April’s end, we now have 2 months of spring season data unaffected by market activity at the end of 2018, when financial markets plunged. By early May 2019, stock markets had recovered to hit new highs...
|

April 2019 East Bay Market Report
A substantial portion of Q1 statistics reflect new listings and accepted offers occurring during the mid-winter market doldrums (Thanksgiving to mid-January).
|

March 2019 East Bay Market Report
Around the Bay Area, spring 2018 was one of the hottest markets in the last 2 decades. Then the market began to cool in summer and autumn - demand, sales and appreciation rates generally dropping, while supply and price reductions increased - before the mid-winter doldrums took hold. The magnitude of these changes varied by region, and the Oakland-Berkeley area was probably...
|
February 2019 East Bay Market Report
As of early February, the government shutdown is over - at least for a couple weeks - the stock market has recovered dramatically from its late 2018 plunge, and interest rates are well down from November highs.
|
January 2019 East Bay Market Report
There were almost too many local, national and international political, economic, social and ecological factors impacting the 2018 market to count.
|

November 2018 East Bay Market Report
Autumn markets in counties around the Bay Area have seen significant shifts, but with wide variance in the magnitude of these changes between areas. So far, the market centered on Oakland and Berkeley has probably seen the least dramatic changes in supply and demand dynamics. A major factor has to be that Alameda County, even after all the home price appreciation of recent years, generally speaking remains distinctly more affordable than San Francisco, San Mateo and Santa Clara Counties.
However, the fact that other regions are seeing considerable shifts to cooler markets - at least over the past few months - may signify further adjustments to come in the East Bay as well. Time will tell: Short-term fluctuations are not uncommon and need to be substantiated over the longer term. Many standard statistics are lagging indicators and take time to reflect changes on the ground. They will bear watching in coming months.
|

The SF Real Estate Market in 2015

The San Francisco Real Estate Market in 2015
Illustrating the Year in 20+ Charts


Quarterly Median Price Chart & Monthly Case-Shiller Chart & Sales by Price Range Chart
Despite anxiety about interest rates, financial markets, housing affordability, unending international crises, and possibly over-valued, high-tech unicorns, the Q4 2015 San Francisco median house sales price, at $1,250,000, is up about 11% from Q4 2014. That dovetails nicely with the S&P Case-Shiller Home Price Index for the Bay Area, which measures appreciation in a different way, but also calculated 11% annual appreciation (through October, its last report). The Q4 condo median sales price, at $1,125,000, is up 13% year over year, but that is influenced by the greater percentage of more recently built, and more expensive, units in the sales mix.
We’ve also updated our popular price maps of San Francisco neighborhoods and the greater Bay Area: Home Price Maps

San Francisco has seen 3 extended periods of home construction: The first ran from the Gold Rush to the 1906 earthquake, when 28,000 buildings were destroyed. The second went from the post-quake rebuilding, with the construction of thousands of Edwardian houses and multi-unit buildings, through the big WWII population surge. Many districts such as the Marina and Sunset/Parkside were built out in the period from 1920 to 1950, with Spanish Mediterranean (in many variations), Marina-style and Art Deco being common architectural styles.
The city's population then went into major decline during the subsequent 3 decades and construction plunged. The third era of homebuilding is all about new condo construction, which began around 1980, ebbed and flowed dramatically with the economy, and is currently booming once again.
Early San Francisco Architecture

A look at a few of the distinctive niches of the market.

San Francisco is famously a city of gorgeous views. For the simple reason of verticality, more condos have views and, generally speaking, more panoramic and spectacular views, than houses. Many other lovely views add to SF home value as well: sweeping city views; park views; marina views; views of Alcatraz, Marin and Mt. Tamalpais; and of the East Bay and Mt. Diablo. A few lucky (typically, very affluent) condo owners have staggering vistas from the windows on all 4 sides of their high altitude units.

After being bludgeoned in 2015 by thousands of articles, predictions and warnings regarding interest rates, here is a look at how much they actually changed over the course of the year: approximately one seventh of one percent. Per recent signals from the Fed, presumably mortgage rates will rise in 2016, but expectations over the last 6 years have been confounded far too often to be sure. Significant increases would certainly worsen the affordability equation for homebuyers financing their purchases.
10 Factors behind the San Francisco Market
Seasonality: Waiting for Spring


The 2 charts above illustrate the extreme seasonality of the market, both in the numbers of new listings coming on market, and the percentage of listings that accept offers (a measurement of supply vs. demand). The second chart also shows that the market for homes under $2 million has been hotter than the luxury home market: There are fewer buyers at the ultra-high end, and luxury homes are also most prone to significant overpricing.
The spring selling season – which actually started in February last year – is typically the most feverish, and this is especially true for luxury homes: Notice, in the 2nd chart, the huge spike in demand for luxury homes last spring.
More statistical, supply and demand graphs: San Francisco Market Overview Analytics
Average Dollar per Square Foot Values


--------------------------------------------------------------------

High-end home sales hit new peaks in spring 2015, but with the stock market volatility in late August and September, the market softened, inventory increased (to its highest level ever) and sales dropped about 17% in October on a year-over-year basis. (Affluent buyers and sellers are most influenced by financial market volatility.) However, the stock market then recovered and stabilized in October and buyer confidence improved, which is reflected in the year over year increase in sales that occurred in November and December. Remember that closed sales in one month generally reflect the heat of the market in the previous month, when the transaction was actually negotiated. Q4 2015 sales ultimately ended slightly up from Q4 2014.
Charts: Luxury House Sales by Neighborhood and Luxury Condo Sales by Neighborhood
Details, Amenities & Size


The above details are as described in MLS by listing agents, so the numbers are very approximate. Also note that what most people might see as a unit above a laundromat, an enthusiastic listing agent might see as a “rarely available luxury penthouse.”


One of the reasons the Pacific Heights district has by far the highest house prices in the city is that its average house size is so much larger. However, its mansions also command a very high dollar per square foot value, as seen in one of the earlier charts.

The sales of condo shall continue to make up a larger and larger share of overall home sales in San Francisco, as new condo construction continues apace.(Condos also turn over more often than houses.) Very few new houses are built in the city – they are usually big, high-tech, beautiful and costly.
Where the Most Home Sales Occur


--------------------------------------------------------------------

San Francisco is very much a boutique market for multi-unit buildings: Our apartment buildings are generally much smaller, older and, for that matter, more gracious than those found in the suburbs. These properties are often at the heart of fierce controversies pertaining to rent control, tenants’ rights, tenant evictions, and condo conversion rules. There has been an immense increase in market-rate rents over recent years – SF is the most expensive rental market in the country– though rules restrict increases for existing tenants of buildings built before 1979 (i.e. almost all of our multi-unit properties).
The Bay Area Apartment Building Market

The tenancy-in-common unit with an exclusive right to occupy, aka the TIC, is a property type rarely found outside of San Francisco. It was originally created as both a way to get sellers of multi-unit properties significantly more money – the individual unit sales adding up to more than the purchase of the entire building by one buyer – as well as providing a lower-cost alternative for homebuyers, since TICs typically cost 10% to 15% less than comparable condos. (The TIC phenomenon also generated significant legal fees for the lawyers who came up with the idea.) Because of changes in tenant-eviction law and condo-conversion rules, financing and other issues, the number of TIC sales has plunged since its peak in 2007. On the other hand, some TIC units are now selling for jaw-dropping prices: In 2015, 4 sold for over $5 million. The median TIC sales price last year was $947,000.


Luxury Market Cools

Median Sales Price by Month

Even with the general cooling in the market since spring and the significant slowdown in higher end home sales, the overall median sales price for houses and condos bounced back up to $1,200,000 in October. Median prices are impacted by seasonal trends: typically peaking in the spring, dropping in the summer, up again in the autumn and then plunging during the winter holidays. This has more to do with inventory than with changes in fair market value. Short-term fluctuations are not particularly meaningful: It is the longer-term trend that gives a sense of what’s going on in the market.
For houses alone, the median sales price in October was $1,300,000 and for condos, it was $1,100,000.
Supply & Demand Statistics by Price Segment, October 2015

Months Supply of Inventory (MSI) is a classic measurement of supply and demand, calculating the time it would take to sell the existing inventory of homes for sale at the current rate of market activity. The lower the MSI, the greater the demand as compared to the supply, i.e. the hotter the market. The house market in San Francisco has been stronger than the condo market since the recovery began – though the condo market has been crazy hot as well – because the supply of houses is more limited and is dwindling as a percentage of sales because virtually no new houses are being added to inventory. However, new condos are being built in quantity. This chart above illustrates the dramatic difference in the markets for homes up to the median price ($1.3 million for houses, $1.1 million for condos) and in the next price segment higher, versus the luxury home segment, defined here as houses selling for $2,000,000+ and condos for $1,500,000+. (By this definition, luxury sales currently make up about 20% of San Francisco’s home sales.)
Because SF has been so hot for so long, we’ve adjusted the thresholds for what MSI readings define “seller’s market” and “buyer’s market” to better reflect the psychology of the current market.

As mentioned earlier, the number of high-end house and condo listings hit all-time highs in October, while sales numbers are well below levels hit in the previous 2 years. Even more so than the general market, the luxury segment is dramatically affected by seasonality and typically goes into deep hibernation from Thanksgiving to mid-January. (See "Seasonality" chart further below.) Having so many active listings on the market just prior to the winter holiday doldrums is one of the reasons why we designate the luxury-home segment as currently having moved into “buyer’s market” territory.

This chart above illustrates the change in the luxury home market supply and demand balance over the past three Octobers. As a further point of context to what has happened in the past year, during the feverish market of this past spring, the MSI for luxury houses hit a low of 1.6 months of inventory and the MSI for luxury condos hit a low of 1.7 months. Since 2012, spring has consistently been the hottest, most competitive, selling season of the year and most home price appreciation has occurred during that time.

------------------------------------------------------------
4 San Francisco Neighborhood Snapshots


Much more information regarding SF neighborhood prices and trends can be found here: San Francisco Neighborhood Values
Average Asking Rents in San Francisco

The real estate market has been challenging for homebuyers these past few years, but for anyone looking to rent a home in the city, it has been distinctly more difficult financially. Homebuyers have the benefit of historically low interest rates, multiple tax advantages and, hopefully, substantial appreciation gains over time; renters enjoy none of those advantages (though admittedly there can be long-term benefits to rent control for renters that qualify). Even with the big jump in home prices over the past 4 years, factoring in the 35% - 40% decline in interest rates and adjusting for inflation, the ongoing monthly cost of homeownership (for someone putting 20% down) is roughly the same as it was in 2007. But average monthly asking rents in the city have surged over 50% during the same period.
This has made rental property ownership an increasingly lucrative proposition, which we discuss in more detail in our last Commercial Brokerage report: Bay Area Apartment Building Market
The S&P 500 and Shanghai Composite Indices July 2014 - November 2015

Not so long ago, grave concerns regarding the Chinese stock market decline and its effect on the U.S. financial and real estate markets filled the media, so we thought it worth revisiting the issue to double-check how it all turned out (so far).
Many comparisons were made between the "frothiness" of both the Shanghai stock market and the U.S. stock market. This chart above gives a little more context to exactly how (un)similar their movements have been over the past 16 months. To add to the anomaly of the widely divergent trend lines, it is generally agreed that during this period, the Chinese economy has been significantly slowing, while the economy of the United States has continued to strengthen.
As of November 6th, the S&P 500 has made up all the losses sustained in the late August-September time-frame, and is now about 6% above its level of July 2014, and 1.3% down from its peak in May 2015. The Shanghai Composite Index, after soaring 150%, for no discernible reason besides fantastically irrational exuberance, between July 2014 and June 2015, then plunged 41%. (This engendered much excited comment regarding the "trillions of dollars" of "value" wiped out.) It is now, after repeated government interventions and limitations on trading, about 31% down from its June peak, but still almost 75% above its level in July 2014.
Median Household Incomes
In Selected San Francisco Zip Codes

By Bay Area County

Additional demographic analyses from previous reports can be found here: San Francisco & Bay Area Demographics andBay Area Affordability

Condo Values + The Most Expensive Condo Buildings in SF


The Most Expensive Condo Buildings in San Francisco


Short and Long Term SF Home Price Appreciation

2011 – 2015, by Quarter

