

Stay Up to Date on the East Bay Market

Return on Cash Investment


All of us should have put every penny we had into Apple stock in 1994, but barring that, purchasing a home in San Francisco would have been a decent alternative – particularly if you’d bought in Noe Valley or the Mission. Three factors not included in the above analysis further increase the financial benefits of home purchase over the other investments graphed: 1) the $250,000/$500,000 capital gains tax exclusion on the sale of a primary residence (potentially saving up to $75,000 in taxes), 2) the “forced savings” effect of gradually paying off one’s mortgage (if one resists refinancing out growing home equity), which has a substantial wealth-building effect, and 3) over time, the ongoing cost of housing with a fixed rate loan, strategically refinanced when rates go significantly lower, will usually fall well below rental costs that continue to rise with inflation.
With financial assets subject to market cycles, changing the buy or sell dates in this analysis can dramatically affect the return. We picked 1994, because of the availability of MLS median price data going back to then.

Median Sales Prices by Neighborhood

Median Sales Prices by Neighborhood 2-Bedroom Condos in San Francisco

3-Bedroom Houses in San Francisco


Market Dynamics


These two charts above illustrate both how competitive the market has been – the average SF home selling without a price reduction sold very quickly for 13.5% over asking price in the 3rd quarter – and the significant difference between homes that get an immediate market response and thosethat have to go through one or more price reductions before selling.
Seasonality, Luxury and Non-Luxury Homes

The lower the Months Supply of Inventory, the stronger the buyer demand as compared to the supply of homes available to purchase. This chart illustrates the seasonality of the real estate market – typically strongest in spring (especially) and autumn, and slowing down during the summer and especially the winter holidays. It also shows that the lower-priced home segment is generally hotter than the higher priced – as shown by the lower MSI readings – and finally, how much more the luxury home segment is affected by seasonality. The dramatic slowdown in the highest-priced segment during summer and winter is one of the big reasons why median home prices usually drop during those seasons.


Autumn Market

September is almost always the month with the largest number of new home listings in San Francisco: The number of new listings hitting the market in September 2014 was 15% higher than the #2 month (May 2014) over the past 21 months. [See chart below] Because Labor Day is so late this year, September only has 3 weeks of selling days after the holiday weekend, and if this is a big listing month – it looks like it might well be – we may find a whole lot of listings crammed into those 3 weeks. Usually, the 5 weeks after Labor Day feed the activity of the entire autumn sales season in SF.

Because of the financial markets recent volatility, it’s possible that some significant percentage of buyers will be warier and hold off until there is more clarity. [This happened a couple years back with the national debt reauthorization standoff in late September/early October.] Media hysteria is not helping, and a raise in interest rates would probably trigger more volatility – at this point, someone stepping on a cat’s tail in Shanghai will probably trigger more volatility. The next Fed meeting is on September 16 & 17th, and there may not be clarity about an interest rate change until then – which won’t stop non-stop speculation.
On the other hand, the Fed might announce (at any time) that no interest raise will occur (or minimize the scale of an increase), there might be a sustained market recovery this week, and last week’s craziness will quickly fade into insignificance.
It’s hard to forecast how the autumn selling season will start this year, especially compared to the utter frenzy of last spring. I don’t know if it makes sense to prepare your sellers for possible alternative scenarios in buyer reaction, but it may be something for you to think about.

SF Neighborhood Affordability-August 2015

Where to Buy a Home in San Franciscofor the Money You Want to Spend
August 2015
The charts below are based upon 2015 YTD transactions reported to MLS by July 24, 2015 . We’ve generally broken out the neighborhoods with the most sales within given price points. To a large degree, if you’re buying a house in San Francisco, your price range effectively determines the possible neighborhoods to consider. That does not apply quite as much to condos and TICs: Generally speaking, in neighborhoods with high numbers of condo and TIC sales, there are buying options at a wide range of price points – though, unsurprisingly, the number of bedrooms increases as prices get higher.
Of course, era of construction, views, average size and many other features and amenities can vary widely between neighborhoods.
The overall median HOUSE price in the city in the 2nd quarter of 2015 was about $1,350,000, so the under million-dollar house is becoming much less common. The vast majority of house sales under $1,000,000 now occur in a large swath of neighborhoods running across the southern border of San Francisco: from Ingleside and Oceanview through Crocker Amazon, Excelsior, Portola and Visitacion Valley to Bayview. These southern border neighborhoods are by far the most affordable house markets in the city. (They don't contain many condos at this point, though some big developments are planned.) Neighborhoods that not so long ago had numerous sales in this price range - such as Central Sunset and Parkside, Outer Richmond, Bernal Heights and Miraloma Park - have now generally appreciated over the last 3 years to the point where such sales are increasingly rare.
The horizontal columns reflect the number of sales under $1 million in 2015 YTD for each area, while the median sales prices noted are for all house sales during the period. Median price is that price at which half the sales occurred for more and half for less.

Where to Buy a CONDO, CO-OP OR TIC for Under $1 million in San Francisco
The overall SF median condo price in the 2nd quarter of 2015 was about $1,125,000. Sales under $1m still occur in almost every area of the city that features these property types, but a studio unit in Russian Hill may cost the same as a 2 bedroom unit in Downtown. Some areas with large volumes of sales, such as South Beach/South of Market or the greater Noe Valley district, offer units for sale at virtually every price point. In such districts, what will vary will be the prestige and amenities of the building, the size and graciousness of the unit, the floor the unit is located on, whether parking is included, and the existence of views and deeded outside space (decks, patios, or, less often, yards).
In the general category of condo, co-op and TIC sales in San Francisco, condos make up about 90% of sales, stock co-op apartments 1 to 2%, with TICs making up the balance. TICs typically sell at a significant discount (10% - 20%) to similar condos, but there are a number of factors that affect the exact price differential.
The horizontal columns reflect the number of sales under $1m in 2015 YTD broken down by sales of 1-bedroom units and sales of 2+ bedrooms.

Spending $1 Million to $1.5 Million
In the charts below, the horizontal columns reflect the number of sales in each area, while the dollar amounts reflect average dollar per square foot values for the homes in this price range in the specified areas.


Buying a HOUSE for $1.5 million to $2 million

Buying a LUXURY HOME in San Francisco
The charts below are broken out by increasingly higher price segments within the overall "luxury" price range.

Luxury HOUSE Sales

San Francisco Neighborhood Map

SAN FRANCISCO REALTOR DISTRICTS
District 1 (Northwest): Sea Cliff, Lake Street, Richmond (Inner, Central, Outer), Jordan Park/Laurel Heights, Lone Mountain
District 2 (West): Sunset & Parkside (Inner, Central, Outer), Golden Gate Heights
District 3 (Southwest): Lake Shore, Lakeside, Merced Manor, Merced Heights, Ingleside, Ingleside Heights, Oceanview
District 4 (Central SW): St. Francis Wood, Forest Hill, West Portal, Forest Knolls, Diamond Heights, Midtown Terrace, Miraloma Park, Sunnyside, Balboa Terrace, Ingleside Terrace, Mt. Davidson Manor, Sherwood Forest, Monterey Heights, Westwood Highlands
District 5 (Central): Noe Valley, Eureka Valley/Dolores Heights (Castro, Liberty Hill), Cole Valley, Glen Park, Corona Heights, Clarendon Heights, Ashbury Heights, Buena Vista Park, Haight Ashbury, Duboce Triangle, Twin Peaks, Mission Dolores, Parnassus Heights
District 6 (Central North): Hayes Valley, North of Panhandle (NOPA), Alamo Square, Western Addition, Anza Vista, Lower Pacific Heights
District 7 (North): Pacific Heights, Presidio Heights, Cow Hollow, Marina
District 8 (Northeast): Russian Hill, Nob Hill, Telegraph Hill, North Beach, Financial District, North Waterfront, Downtown, Van Ness/ Civic Center, Tenderloin
District 9 (East): SoMa, South Beach, Mission Bay, Potrero Hill, Dogpatch (Central Waterfront), Bernal Heights, Inner Mission, Yerba Buena
District 10 (Southeast): Bayview, Bayview Heights, Excelsior, Portola, Visitacion Valley, Silver Terrace, Mission Terrace, Crocker Amazon, Outer Mission
Some Realtor districts contain neighborhoods that are relatively homogeneous in general home values, such as districts 5 and 7, and others contain neighborhoods of wildly different values, such as district 8 which, for example, includes both Russian Hill and the Tenderloin.
Buyers Groan Sellers Rejoice June 2015 Market Report

June 2015 San Francisco Real Estate Report
Short-Term Trend Line: Since the Recovery Began in 2012

Longer-Term Trends: 1993 – 2015

------------------------------------------------------------
Neighborhood Appreciation Snapshots May 2011 – May 2015
Central Sunset, Central Richmond & Noe Valley: Median House Sales Prices

SoMa, Eureka Valley & Marina: 2-Bedroom Condo Median Sales Prices

Link to San Francisco Neighborhood Map
------------------------------------------------------------
Luxury Home Sales by District


High-end home sales and prices in the city have been increasing rapidly, with interesting shifts occurring between older high-prestige neighborhoods like Pacific Heights and Russian Hill, and areas such as Noe Valley and South Beach, where surging sales of very expensive homes are a more recent phenomenon.Part of this shift is being fueled by the explosion of younger, high-tech wealth; another part is the recent construction boom of high-rise, ultra-luxury condo buildings south of Market Street.
There is an enormous variety in high-end real estate in San Francisco, from mansions to penthouses, Victorians to new, ultra-high-tech construction, as can be glimpsed in the list of sales at the end of this report. One of the more common amenities is spectacular views.
------------------------------------------------------------
Home Sales by Price Segment, 2015 YTD

Four years ago, one found the most homes for sale in the $600,000 to $750,000 price segment. Now $1 million to $1.5 million is the “sweet spot” for San Francisco home prices.
------------------------------------------------------------
Overbidding List Prices

When the average SF home sale is selling for 10% over the original asking price, the market is characterized by fiercely competitive buyer bidding wars. Another indicator: Almost 93% of home sales in May sold without going through any price reductions, an astonishingly high percentage.
These charts above and below, along with the one at the top of this newsletter delineating quarterly median price movements, also illustrate the seasonal nature of real estate sales. For 4 years running, the hottest, most competitive markets have been during the spring selling season. The market often cools down during the summer.

------------------------------------------------------------
Economic Indicators


Two of the biggest factors affecting the San Francisco real estate market are extremely low interest rates, which have a large impact on the ongoing cost of homeownership, and surging, well-paid employment. According to Ted Egan, San Francisco’s Chief Economist, high-tech jobs alone jumped by 18% in the 12 months through March 2015, and as of April, the city’s unemployment rate, at 3.4%, was the lowest since the height of the dotcom boom.
Interest rates are almost 40% below those in 2006 – 2007. With home prices having increased so much recently, future interest rate changes will be something to watch carefully for their impact on affordability. Rates have been inching up recently and just hit 4% for the first time in 2015, but they are still very low by any historical measure.
------------------------------------------------------------
Highest Home Sales by Neighborhood, 2015 YTD
This is a sampling of highest sales prices achieved in selected San Francisco neighborhoods in 2015 YTD, as reported to MLS. Note that this is not a comprehensive list of the city’s highest priced home sales.
$31,000,000. Pacific Heights: 7-bedroom, 16,400 sq.ft. mansion on Broadway, $1890/sq.ft.
$11,000,000. Sea Cliff: 5-bedroom, 3600 sq.ft., ocean-front house on Sea Cliff Ave., $3068/sq.ft.
$9,250,000. Pacific Heights: 2-bedroom, 3500 sq.ft., 1927 co-op on Alta Plaza Park, $2643/sq.ft.
$9,100,000. Russian Hill: 2-bedroom, 3300 sq.ft. co-op at Royal Towers, $2742/sq.ft.
$7,000,000. Noe Valley: 5-bedroom, 1907, 4450 sq.ft. house on Elizabeth Street, $1571/sq.ft.
$6,500,000. Alamo Square: 6-bedroom, 1902, 7800 sq.ft. mansion on Fulton, $833/sq.ft.
$6,285,000. St. Francis Wood: 5-bedroom, 6700 sq.ft. mansion on half-acre lot on San Anselmo Ave., $938/sq.ft.
$5,600,000. Dolores Heights: 4-bedroom, new construction house on Noe Street
$5,500,000. Nob Hill: 3-bedroom, 2721 sq.ft. TIC at Park Lane, $2021/sq.ft.
$5,475,000. SoMa: 3-bedroom condo at Four Seasons
$4,995,000. South Beach: 3-bedroom penthouse condo on South Park
$4,200,000. Glen Park: 4-bedroom, new construction, 3400 sq.ft. house on Laidley, $1235/sq.ft.
$4,000,000. Yerba Buena: 2-bedroom, 1952 sq.ft. condo at Millennium, $2049/sq.ft.
$3,900,000. Lake Street: 3-bedroom, 2952 sq.ft., 1914 Edwardian, $1321/sq.ft.
$3,850,000. Golden Gate Heights: 5-bedroom, 4062 sq.ft. 1974 house on Pacheco, $948/sq.ft.
$3,150,000. Bernal Heights: 4-bedroom, 2293 sq.ft., 2011 house on Folsom, $1374/sq.ft.
$3,100,000. Inner Mission: 3-bedroom, 2800 sq.ft. house on Shotwell, $1107/sq.ft.
$3,000,000. Inner Richmond: 3-bedroom, 4225 sq.ft. 1912 Edwardian on 10th Ave., $710/sq.ft.
$2,885,000. Inner Sunset: 3-bedrrom, 2640 sq.ft. 1904 Edwardian on 6th Ave., $1081/sq.ft.
$2,715,000. Hayes Valley: 4-bedroom, 3808 sq.ft. TIC on Waller, $713/sq.ft.
$2,510,000. Forest Hill: 5-bedroom, 3300 sq.ft., 1926 house on Taraval, $761/sq.ft.
$2,400,000. Potrero Hill: 3-bedroom, 2434 sq.ft., 1908 Edwardian on Kansas, $986/sq.ft.
$1,900,000. Sunnyside: 4-bedroom, 2715 sq.ft., 2003 house on Mangels, $700/sq.ft.
$1,280,000. Portola: 5-bedroom, 3128 sq.ft. new construction house on Madison, $409/sq.ft.
$900,500. Bayview: 4-bedroom, 1626 sq.ft., 1996 house on Armstrong, $554/sq.ft.

SF New Construction Housing Trends

San Francisco New-Housing Construction Trends
April 2015 Report by Paragon Real Estate Group
Many of the charts included in this report are based on or excerpted from the San Francisco Planning Department’s 82-page 2014 Housing Inventory report, released in April 2015, which can be accessed using the link at the bottom of this article. Much of the text below detailing housing-inventory statistics is excerpted from this report as well.

The new-housing landscape in San Francisco is in constant flux: new projects, developer plan changes, city plan changes, and shifts in economic and political realities. The basic reality is that the city, after its recent 2008-2012 new-construction slump, is now experiencing a huge building boom. So far, however, it has not been able to keep up with accelerating population growth, soaring employment and concomitant surging buyer/renter demand.

“Some of the larger projects completed in 2014 include: 1411 Market Street/NEMA Phase II (437 market-rate units and 52 affordable inclusionary units), 185 Channel Street (315 market rate units), Rincon Hill Phase II (312 market rate units).The 1190 4th Street (100% affordable 150 units) and St. Anthony Foundation’s 121 Golden Gate Avenue (100% affordable 90 senior housing units) are two major affordable housing projects completed in 2014.”

“Some of the major projects authorized for construction during the reporting year include: 2801 Brannan Street (434 units); 3350 8th Street (408 units); 250 4th Street (208 units); and 588 Mission Bay Boulevard (200 units).”

Residential Development by City District


New Development Pipeline
There are over 50,000 housing units of all kinds currently in the pipeline - and the pipeline is growing and changing quickly now - but some of the bigger projects (such as Treasure Island and Hunter's Point/Shipyard) may take decades to complete.

--------------------------------------------------
Construction vs. Conversion

“Thirty-three single-family units were added in 2014: Single-family building construction made up a very small proportion of new construction in 2014 (1%).” Very few new houses are built in San Francisco, as developers prefer to build higher density housing projects on our limited supply of land. The houses that are built are typically big and expensive.
“New condominium construction in 2014 dropped to 1,977 units from 2,586 units in 2013. Condominium conversions were up by 98% in 2014 (730 from 369 conversions in 2013). This number is 20% higher than the 10-year average of 606 units.” The rules governing condo conversion in San Francisco are byzantine, politically-wrought and, seemingly, ever-changing, and the changes affect the ability to convert existing multi-unit properties and TICs into condominiums. .
Affordable Housing Construction


Very generally speaking, the city requires that new home developers either dedicate 15% of their units to affordable housing, which could be built on-site or on another city site, or contribute to the city’s affordable housing fund “in lieu” of building the units themselves.(The rules are more complicated than that, but that’s the general idea.) There are few subjects more politically charged in San Francisco than affordable housing: how much should be built where and who should be responsible for the costs.
“In 2014, 757 new affordable housing units were built. These new affordable units made up 21% of new units added to the City’s housing stock. This count includes 267 inclusionary units and 59 units added to existing structures. About 83% of the new affordable units are rentals affordable to very-low and low-income households.” These units are allocated, rented and sold under rules and formulas pertaining to social and economic circumstances and housing cost. Large projects are also built on an ongoing basis by private-public social organizations for dedicated purposes such as senior housing.
“In 2014, a total of about $30 million was collected from developers as partial payments of in-lieu fees for projects.”
Major affordable housing projects completed in 2014 include: 1190 4th Street (150 units); 121 Golden Gate Avenue (90 units); 378 5th Street (44 units); 833-871 Jamestown Avenue (96 units); 1600 Market Street (23 units); and 63 West Point Road (15 units).
Housing Units Demolished, Merged and Abated

“Dwelling units are gained by additions to existing housing structures, conversions to residential use, and legalization of illegal units. Dwelling units are lost by merging separate units into larger units, by conversion to commercial use, or by the removal of illegal units. The net gain of 155 units from alterations in 2014 is comprised of 200 units added and 45 units eliminated.”
The Context behind San Francisco New-Housing Development Population, Employment, New Supply vs. Demand

<

--------------------------------------------------
Insufficient Housing = Increasing Prices & Rents


--------------------------------------------------
New Housing Construction by Bay Area County

SF Housing Stock by Building Size

--------------------------------------------------
Condo Values by Era of Construction

The first golden age of SF apartment buildings, many of which were later turned into condos, was in the period of 1920 – 1940: The units in these buildings are large, light, gracious and filled with elegant detail. Pacific Heights and Marina are filled with these buildings. Though there are beautiful condos built in other eras (Edwardian flats, Art Deco apartments), the second golden age really arrived with the latest burst of new-condo construction, built for an increasingly affluent population: These units are ultra-modern, high-tech and feature highest quality finishes and amenities. They are exemplified by the new, luxury high-rises of the greater South Beach-Yerba Buena area, though variations on this theme, in non-high-rise form, have been springing up all over the city.
The units in these newer buildings command a premium both when rented or, as seen in the chart above, when sold – now surpassing an average dollar per square foot value of $1000. This is the major motivator for developers today.
Housing Unit Construction by Bedroom Count


We haven’t found an easy place for construction data by unit size, so this first chart above is extrapolated from SF MLS sales of condos built 2001 -2015. It may not apply perfectly to units built as apartment rentals or affordable housing.
Typically, the smaller the unit, the higher the dollar per square foot value on sale or rental, however in San Francisco, 3+ bedroom condos are often high-floor units with spectacular views that sell for extraordinary sums – but these would be outliers to the general rule. The city plan appears to have a bias for 2-bedroom units, which it designates as “family units” – this may be an anachronism considering that 38% of city residents live alone and that SF has the lowest percentage of children of any major U.S. city.Lately there has been a push by developers (and some housing advocates) toward smaller or even “micro” units, but other segments in the decision-making chain in the city, such as supervisors and neighborhood community groups, often push back against allowing this trend to gain traction in the city.
The politics of new home development in San Francisco is not for the weak of heart. There are very, very strong opinions and pressures regarding how it should best proceed.
San Francisco Planning Department Pipeline & Housing Inventory Reports
Below are links to the SF Planning Department Pipeline and Housing Inventory report webpages. They contain huge amount of data, which we have attempted to represent accurately.As noted by their authors, who did an incredible job, the original reports themselves are “compiled and consolidated from different data sources and subject to errors due to varying accuracy and currency of original sources.”
San Francisco Planning Department Pipeline Report
And this image-link goes to a flowchart of the Planning Department’s review and approvals process:

© April 2015 Paragon Real Estate Group
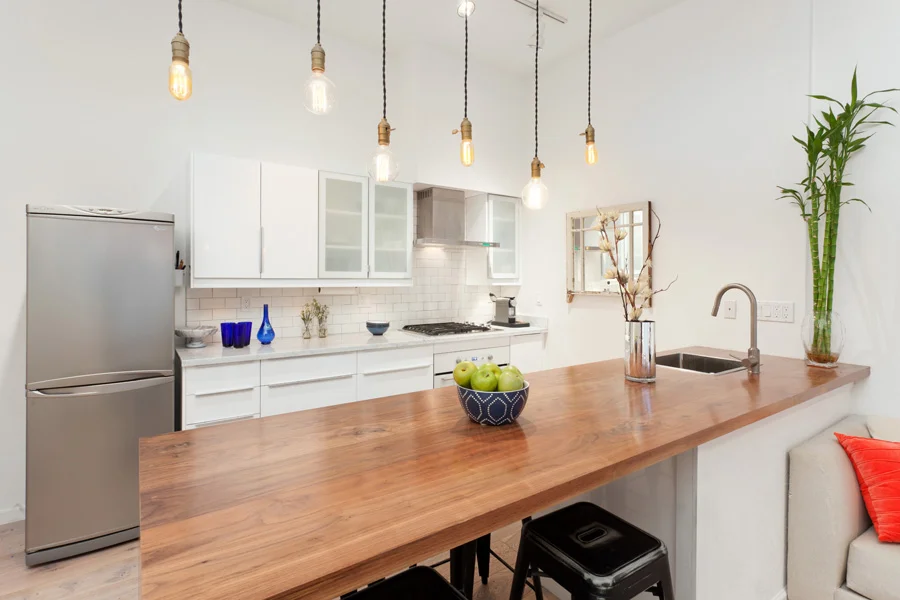
Fantastic 2bd Condo in Trendy NOPA

Fantastic 2 bedroom 1 bath condo located in the thriving NOPA neighborhood. This home features a beautifully remodeled kitchen and lovely tall ceilings in every room. It also offers one car independent garage parking, additional storage and laundry facilities.
- 2 Bedrooms
- 1 Bathroom
- 1 Car Garage
- Condo, Townhome, Duplex
- Mls Number 431319
- 1060 Sq Ft*
- Built 1982*
- HOA Dues $175/Mo
- Additional Storage
- Shared Laundry
Open Houses
Saturday 4/18 2-4pm
Sunday 4/19 2-4pm
Tuesday 4/21 11-12:30pm
Wednesday 4/22 5:30-7pm
Sunday 4/26 2-4pm
Additional Showings by Appointment, Call Simone Koga 415-706-1586

First Quarter Market Update

The San Francisco Real Estate Market
First Quarter 2015 Update
Median Price & Dollar-per-Square-Foot Appreciation; Prices & Price Reductions; Comparing Bay Area County Markets; the Story behind Low Inventory
April 2015, Paragon Real Estate Group

------------------------------------------------------------
More Affordable Neighborhoods Take Off
When the SF market recovery began in 2012, the more affluent neighborhoods led the way in rapid home-price appreciation, but in 2014, the more affordable neighborhoods took the lead. Of course, there are few places outside San Francisco where houses of $1.2 million would constitute the “affordable” segment of the market, but as median house prices in the greater Noe, Eureka & Cole Valleys area accelerated over $2 million (and over $4 million in the Pacific Heights-Marina district), buyers started to fan out, desperately looking for less expensive options. That sparked increased competition and the chart below illustrates the resulting year-over-year appreciation rates in some of those neighborhoods.
This is not to suggest that the higher-end house markets in the city are languishing. That is not the case – the markets are crazy there too – but generally speaking, recent appreciation rates have not been as robust as in less costly neighborhoods. Information on home prices around the city can be found here: SF Neighborhood Values.

Statistics are generalities that can be affected by various factors, and different baskets of unique homes sell in different quarters. And different statistics can disagree: For example, as seen above, Bernal Heights, which has been white hot, saw year over year median price appreciation of 10%, but its average dollar-per-square-foot value jumped 19%. Consider these statistics to be general indicators instead of precise measurements of changes in home values.
Sales Prices, Price Reductions and Days on Market
Further indications of the heat of our market: The vast majority of sales in March sold very quickly, without going through a price reduction, and averaging a whopping 10% over asking price. That relatively small percentage of listings that went through price reductions prior to sale took 3 times longer to sell at a significant discount to original list price. And, of course, not every home sells: If a property is deemed significantly overpriced, buyers typically ignore it and, unless price reduced, the listing will ultimately be withdrawn from the market. A hot market doesn’t imply buyers will pay any price that pops into a seller’s head (though sometimes it may seem so).

------------------------------------------------------------
Factors behind the Low Supply of Homes for Sale
Lately, there have been many articles about the reasons why sellers aren’t selling, which is supposedly the main cause of the market’s drastically low inventory situation. What is rarely mentioned is that by far the biggest factor behind declining inventory is not that sellers aren’t selling, but simply the greatly increased demand over the past 3 years. The number of sales in 2014 was actually about average for the last 15 years. Mostly, it was the competition among greater numbers of buyers that shrunk the supply of homes for sale at any given time.
Below is Slide 3 of three charts from our full report (The Real Story behind Low Inventory). It shows how inventory declines as buyer demand increases, even if the number of new listings coming on market doesn’t fall. Please see the full analysis for our complete reasoning, as well as a list of other subsidiary factors.
The simplified, sample illustration below uses actual data pertaining to buyer demand in the city over recent years, but assumes that the number of new listings stays steady at 600 per month.

------------------------------------------------------------
Comparing Bay Area County Markets
These 3 analyses are excerpted from our recent article, Taking the Temperatures of Bay Area Real Estate Markets. The full report includes 5 other charts, all of them fascinating.


------------------------------------------------------------

Renting Instead of Selling Your Home

Renting Instead of Selling Your Home
Depending on your circumstances, plans and current market conditions, renting one’s home instead of selling it may certainly be an option worth seriously considering. If you don't need your sale proceeds to buy your next home, owning rental property may be a viable, long-term investment choice, especially if rental rates are high and interest rates are low (as they are in San Francisco, as of April 2015). However, there are additional factors to keep in mind as you make your decision. 1. In San Francisco, renters may reduce your home's property value for the following reasons:
- Rental properties rarely show as well as owner-occupied properties and renters sometimes neglect basic upkeep and maintenance.
- If your property is subject to SF rent control/eviction limitations – which most properties built before 1979 are – evicting tenants or paying them off to move without eviction in order to sell the home later may be prohibitively expensive, take long periods of time or simply be legally impossible. (You should consult a landlord-tenant attorney.)
- SF tenants under the rent control ordinance are now owed significant relocation fees upon eviction – thousands of dollars per tenant. Buyers will want to be compensated for that cost.
- If it’s impossible to evict the tenants, then you have to show it while tenant occupied, which can bring up multiple issues pertaining to appearance, showings, open houses, and tenant resentment and lack of cooperation. It also makes it virtually impossible to perform any staging of the home to make the property show in its best possible light.
- Many home buyers simply don’t want to buy tenant occupied homes and those willing to deal with the issue usually expect a significant discount on the price.
2. Managing a rental property and tenants can be a hassle—the calls about broken plumbing on Thanksgiving Day may not be something you wish to deal with. And if you hire a professional property manager, there will be a major additional expense to deduct against the rental income.
3. If you are able to get the tenant to vacate the property prior to the listing period, a vacant house will have to be staged to show at its best. It costs money to stage an empty property and it costs money to keep the house vacant during the listing and sale period.
4. Renting for an extended period may affect the $250,000/$500,000 exclusion from capital gains tax for owner-occupied properties upon sale.
5. If you want to own rental property, you will typically get a better return on investment from multiple-unit properties than from single family dwellings and condos.
Note: If you do decide you wish you rent out your home, Paragon has a very able rental department which specializes in this exact situation.

Pros and Cons of Off-MLS Pocket Listings

Pros and Cons of Off-MLS Pocket Listings
What was once an unusual way to market homes – outside of the local Association of Realtors Multiple Listing Service (MLS) – has become, with the heating up of the market, much more common. The question is: does this make sense for most sellers?
There are basically three reasons for trying to sell your home as what is variously called a pocket listing, an off-market sale or an off-MLS listing:
Those are all valid reasons, but you should be aware of the potential trade-off you’re making.
What typically achieves the highest possible sales price?
One thing has become very clear in the current red-hot market: it is not uncommon for one, specific buyer to be willing to pay significantly more than anyone else, when they’re in competition with other buyers. The reason behind comprehensive marketing, including listing the property in the Multiple Listing Service – which is probably the single best way of getting the word out to buyers and their agents – is firstly, to reach that highest paying buyer (in the overall effort to reach every possible buyer), and secondly, to orchestrate as big a competitive bidding situation as possible – or at least the fear of impending competition in that buyer’s mind.
Without comprehensive marketing, it is much less likely that this "best" buyer will hear of your home being for sale in the first place, as well as being much less likely that a dynamic competitive bidding situation can be orchestrated. In either or both of those cases, it is quite possible you will sell your home for less, and perhaps significantly less, than you could have.
It might seem like an excellent price:
If you do sell your home “off-MLS” in this market, it’s quite conceivable that you’ll find a buyer who will pay what appears to be a very good price. But there is simply no way to tell if you are getting the best price achievable, or even, by definition, current fair market value. This is especially true in a rapidly appreciating market. Might there have been somebody else, who, if they knew about the opportunity, would have paid more?
Obviously, it's not possible to sell the same property, at the exact same point in time, both through MLS and through an off-MLS "pocket listing" sale, and then compare the results. However, Matt Fuller and Britton Jackson of JacksonFuller, completed a recent analysis* of all residential property transfers reported to the San Francisco Assessor- Recorder in 2013: They concluded that approximately 89% of 2013 SF home sales occurred through MLS and 11% occurred off-MLS, which generally gibes with research we've performed here at Paragon. They then found that homes sold off-MLS averaged sales prices 9% to 17% less, depending on property type, than MLS-marketed properties. Now, this doesn't constitute "proof" because each transaction has unique circumstances, but it is an indication of what a seller might be sacrificing in sales price. Even if the difference is actually closer to 5%, with a median San Francisco home price of over $900,000, that's more than $45,000 lost.
Beware of agents making self-serving recommendations:
So, there are valid reasons to make the conscious decision to go the pocket-listing/ off-market/ off-MLS route, as long as you realize that you might not get as high a price as you could have otherwise. What are not valid reasons are your agent or broker desiring, by not publicizing the listing to other agents, to “double-end” the sale (i.e. represent both you and the buyer) and thus earn twice the commission, or your agent preferring not to spend the time, effort and money to comprehensively market and show your home to get you the best price and terms. In both those scenarios, your agent is putting their interests above your interests – which, by the way, is a violation of their legal, fiduciary duty – and you should find another agent to represent you in the sale of your home.
* Off-MLS Sales in 2013: Home Run or Foul Play? by Fuller and Jackson, 2014.

The Story Behind San Francisco's "Extremely Low Inventory"

The Story behind San Francisco’s “Extremely Low Inventory”
(It’s not because no one is selling)
Paragon Real Estate Group, April 2015
From another angle, studies have estimated that on average about 5% of U.S. owner-occupier homeowners sell annually. According to the census, there are approximately 125,000 owner-occupied housing units in SF: 5% would equal about 6250 home re-sales per year. Sales of tenant-occupied homes and new construction condos would be additional.
The numbers of new listings and home sales in San Francisco are certainly lower than expected in such a hot market and some of the subsidiary reasons (including homeowners deciding not to sell) are discussed at the end of this analysis. However, as seen above, annual sales numbers are not wildly out of whack from historical trends.
The principal factor behind the perception of drastically low inventory is simply hugely increased demand: Over the past 5 years, the city’s population and employment rolls have soared, while new housing construction has not remotely kept pace. Higher demand means homes sell more quickly, which then shrinks the number of listings on the market at any given time (which is really how we perceive supply, i.e. in the context of the time period in which a buyer is looking).
An analogy might help explain this: A water hole (of listings for sale) is fed by a relatively constant stream (of new listings coming on market), but it still gets significantly diminished as more people drink from it.
Below are 3 charts illustrating the issue. The first two, regarding days-on-market and percentage of listings accepting offers, are based on actual SF market statistics. The third chart is a sample illustration of the effect of increasing demand on the supply of homes for sale, even if the number of new listings coming on market doesn’t decline.

Chart 2: The percentage of listings selling each quarter has significantly increased.

Chart 3 (sample illustration): Higher demand – even with a constant number of new listings coming on market – dramatically decreases the inventory of homes for sale at any given time.
This illustration assumes 600 new MLS listings hitting the SF market each and every quarter, which is close to the average for recent years. In the real world it ebbs and flows by season and, to a lesser degree, sometimes by year.
There certainly are other, distinctive, but lesser factors exacerbating our low inventory market:
1) As noted earlier, with the frenzied market, more sales have been occurring off-MLS, and these homes usually won’t show up as new listings in the public inventory of listings for sale. (The Pros & Cons of Off-MLS Listings)
2) Annual sales of TIC units and 2-4 unit buildings have plunged in the last 7 years by over 500 sales, a substantial drop in an overall market of San Francisco’s size. This is probably due mostly to substantive changes in SF tenant eviction and condo conversion laws. (Note: TIC units are a property type found virtually no place else but the city.)
3) With extremely high rental rates and extremely low mortgage interest rates, a small but growing percentage of homeowners, who typically would have sold their homes, are renting them out instead – and the Airbnb vacation-rental phenomenon (with even higher rent rates) can only be adding to this. (Renting vs. Selling One’s Home)
4) Unless they’re moving out of the area, some potential sellers are so daunted by the challenge of finding new homes under existing market conditions, they are simply staying put until things calm down.
5) A sizeable percentage of our new (mostly very high-end) condos are being purchased as second homes by the locally affluent or as investments by foreign buyers. These non-resident buyers add to demand and help soak up supply, and for a number of reasons, may not sell as often as typical homeowners.
6) With the Bay Area jobs market so strong - it's the strongest in the nation - fewer people are relocating for new jobs elsewhere. They're finding them here instead.
In many counties other than San Francisco, the big decline in distressed property sales has affected inventory and sales.
The factors above are all probably diminishing listing inventory to greater or lesser degrees, but ultimately, it’s not that the annual number of new listings – i.e. the number of homeowners selling – is so drastically low by historical measures. It’s the relationshipbetween supply and demand that fundamentally determines market conditions, and for the last 3 years, a relatively stable supply has become terribly inadequate to a dramatically escalating demand.
This, of course, is the classic dynamic which puts upward pressure on home prices.

New Construction Update- 72 Townsend Pricing
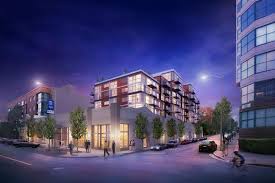
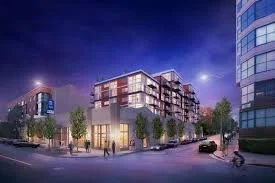
 Located in the thriving and bustling South Beach neighborhood, 72 Townsend is finally ready to sell. The first release comprises of 20 units located on the 3rd and 4th floors. Offers will be taken starting today 3/12- 3/21. 3rd floor units have sizable terraces and 4th floor units have great balconies (no views though).
Showings are by appointment only and as it is an active construction zone, closed toe shoes and hard hats are required. Call me at 415-706-1586 if you'd like to schedule your showing right away.
3rd Floor
1 bedrooms: $955,000-1,399,000
2 bedrooms: $1,496,000-1,695,000
4th Floor
1 bedrooms: $1,021,250-1,349,250
2 bedrooms: $1,520,000-1,656,250

Feverish Spring Market

Sales statistics of one month generally reflect offers negotiated 4 – 6 weeks earlier, i.e. they are a month or so behind what’s actually occurring in the market as buyers and sellers make deals. Sales volume in January and February was down 20% year over year, reflecting a market that pretty much shut down in the last two weeks in December, and then started the year with extremely low inventory.

This chart above illustrates seasonal trends in competitive bidding, which underlies the phenomenon of homes selling for over asking price. For the last few years, the average percentage of sales price to list price has been peaking in spring. But already in February, prices averaged a whopping 8% above asking – very few other markets in the country are seeing anything similar. Drilling down by property type, SF house sales in February averaged 12% over asking, condos averaged 7% over, and 2-4 unit buildings 2%. Houses are becoming a smaller and smaller percentage of city home sales (since virtually no new ones are being built), which has generally made them the most competitive market segment.
In previous years, the percentage over asking has peaked in May, reflecting offers negotiated in late March, April and early May.
Inventory


Seasonality in the Bay Area often has more to do with summer and winter holidays than the actual weather since, unlike back east, January and February often look more like spring here. New listings and overall inventory bottom out in December, and then slowly rise in the new year. What is super-charging the market is that buyers woke up after the holidays and jumped back in the market much earlier than sellers have put homes up for sale in quantity. For the past 3 years, this unbalanced dynamic between the high pressure of buyer demand pushing against an insufficient supply of listings continued through spring, causing dramatic home-price increases, until the market slowed during the summer. We shall soon see if prices can jump higher once again in coming months.
Days on Market before Acceptance of Offer
Months Supply of Inventory


The greater the demand, the faster listings go into contract (i.e. accept offers), and the lower the average days on market (DOM) and months supply of inventory (MSI).Both these statistics are currently in deep “seller’s market” territory. Of course, this could change dramatically if we get a sudden tsunami of new listings or if a large, negative economic event happens, but right now, we don’t have any reason to expect either to occur in the next few months.
As points of comparison, the national average days-on-market is more than twice that of San Francisco’s (approximately 69 days vs. 30), and the national MSI figure is almost 3 times higher than the city’s (approximately 4.7 months of inventory vs. 1.6). Many new listings in San Francisco are going into contract within 7 to 14 days of coming on market, as eager buyers swarm over them.
Bay Area Median House Prices
This map gives a very general idea of comparative home values around the Bay Area. Remember that median prices will often disguise enormous variety in the underlying individual home sales.
We’ve also updated our SF neighborhood map for house and condo prices, which can be found online here: San Francisco Median Home Price Map

------------------------------------------------------------
Renting vs. Buying in San Francisco

Someone moving to or within San Francisco basically has 2 choices: Renting at market rate or buying at market rate. And rents have gone up so much locally that after accounting for multiple tax benefits, low interest rates, principal loan-balance pay-down (which adds to home equity) and estimated long-term appreciation, buying often looks like the financially attractive course. Above is one chart of a much more detailed analysis comparing the cost of renting a 2-bedroom San Francisco apartment at the current median asking rent, with the monthly cost of buying an SF home at the current median sales price after adjusting for tax deductions and principal pay-down.As seen above, the net monthly cost of buying can be less renting.
There are many personal and monetary issues that pertain to this decision and our analysis is based on a number of financial assumptions – interest, inflation, appreciation and tax rates; downpayment amount; maintenance and insurance costs – that you may not agree with or might not apply to you. You can review our full analysis and also perform your own calculations here: Renting vs. Buying in San Francisco
The real estate market is often spoken about as if it was a single monolithic entity performing in a consistent way – but nothing could be further from the truth. Markets vary enormously between states, cities, neighborhoods, property types and price segments. The S&P Case-Shiller Index looks at the Bay Area market* by breaking all house sales into 3 price segments – low, mid and high price tiers – each containing one third of the total number of sales.The exact price range of each tier changes as the market appreciates or depreciates, or more sales occur in one price range than another: Right now, the “high-price tier” starts at $872,000. In February of 2012, the high tier started at a threshold of $537,000.
Breaking down the market by price segment is a vast over-simplification – there are many other factors at play – but generally speaking, the lower the price range, the more the housing segment was impacted by subprime/ predatory lending in 2003 – 2006. In turn, that caused the larger price bubble, and then the bigger crash as the foreclosure/ distressed-property crisis took hold.
Most Bay Area counties are dominated by homes in 2 price tiers, low and mid, or mid and high, but there are pockets of homes in all tiers within most counties. The numbers in the 3 charts below all relate to a January 2000 value designated as 100. Thus a reading of 199 indicates a home price 99% above that of January 2000.
Interestingly, this price segment was not impacted by the popping of the dot-com bubble, perhaps because these homeowners were less likely to be speculating in the technology stock market.

The mid-price segment was less hammered by subprime, but still significantly impacted. Its appreciation rate was 119% from 2000 to 2006 and its market then crashed about 42% before starting its recovery in 2012. This segment is now up 55% from the bottom and close to its 2006 peak value. Many homes in northern Marin, the southern border neighborhoods of San Francisco, northern San Mateo and various areas of the other counties fall into this price segment.

Most of the houses in San Francisco, San Mateo and southern Marin, as well as affluent areas in other counties, fall into the high-price third of Bay Area sales, which was not deeply affected by subprime lending and foreclosure sales. Though its bubble and crash seemed dramatic enough to those experiencing them, they were much smaller: It appreciated 84% from 2000 to 2006, including a hiccup drop in 2001 after the popping of the dot-com bubble, and then fell about 25% (compared to 60% for the low-price tier). Its strong recovery since 2012, up about 44%, has now put this segment approximately 8%above its previous peak value in 2006.

Though the price tiers had radically different bubbles, crashes and recoveries, all 3 are now almost exactly the same in relation to the year 2000, showing appreciation of 97% to 99% over the past 15 years. This suggests equilibrium is once again being achieved between them.
* Technically the Case-Shiller San Francisco Metropolitan Statistical Area is comprised of San Francisco, Marin, San Mateo, Alameda and Contra Costa counties, but we believe its general trends apply to other Bay Area counties as well.
San Francisco Combined House & Condo Median Sales Price

Selected U.S. City Median Rents Chart courtesy of California Association of Realtors

San Francisco Median Sales

Unit Sales Trends by Property Type

The second chart above illustrates sales volume by property type. Houses turn over much less often than condos or TICs – i.e. house owners generally live in their homes longer before selling – and with virtually no new houses being built in the city, house sales as a percentage of total sales are declining, but this has also made them the market’s highest-demand, most competitive segment. Condos now dominate SF home sales and will continue to do so with the many new-condo projects being built. TIC sales are down almost 60% from 2007, probably due to financing conditions and changes in condo conversion and tenant eviction laws. The number of listings fell last year putting additional pressure on the market.

SF New Construction & Population Trends Since 1940
Another note: the housing "units" built in 1940-1950 were not only much more numerous, but were typically 2-3 bedroom houses, while since 1980, the units built have generally been 1-2 bedroom condos and apartments (which makes sense with our changing demographics - more singles and couples, fewer families - but obviously hold fewer people per unit). And now a big topic in development is building urban “micro-units” of 250 to 350 square feet.
Our chart on SF population growth follows as a counterpoint.

Condo Values by Size and Era of Construction

As increasing quantities of “luxury” condos come on market in coming years, it will be interesting to see how the market reacts and absorbs the new inventory.


Home Appreciation vs Inflation
This is a very simplified calculation of a complex financial scenario that includes leverage, financing terms and interest rates, inflation, appreciation, multiple tax benefits and housing costs – you should talk to your accountant – but it still illustrates why a recent New York Times op-ed piece (11/30/14, “Homeownership & Wealth Creation”) said, “Renting can make sense as a lifestyle choice or because of income constraints. As a means to building wealth, however, there is no practical substitute for homeownership.”
